In modern Windows environments, system administrators often work in a space where convenience hides complexity. Graphical interfaces, automated deployment tools, and cloud-managed services have made many routine tasks feel effortless. However, beneath this layer of simplicity lies a deeply structured networking architecture that continues to govern how systems communicate. PowerShell, in particular, acts as a direct window into this architecture, allowing administrators to interact with system components in a way that aligns closely with how those systems actually function.
One of the most overlooked aspects of daily system administration is the dependency chain that supports every network interaction. When a file is accessed from a shared location, when a remote server is queried, or when an application communicates with an external service, multiple layers of networking logic are involved. These layers are not abstract concepts reserved for exams or certifications; they are active components that determine whether communication succeeds or fails.
PowerShell cmdlets provide a structured and readable way to interact with these layers. Rather than relying solely on graphical tools that may hide important diagnostic information, cmdlets expose the underlying behavior of the system. This becomes especially important in troubleshooting scenarios, where understanding the root cause of a problem requires more than surface-level observation.
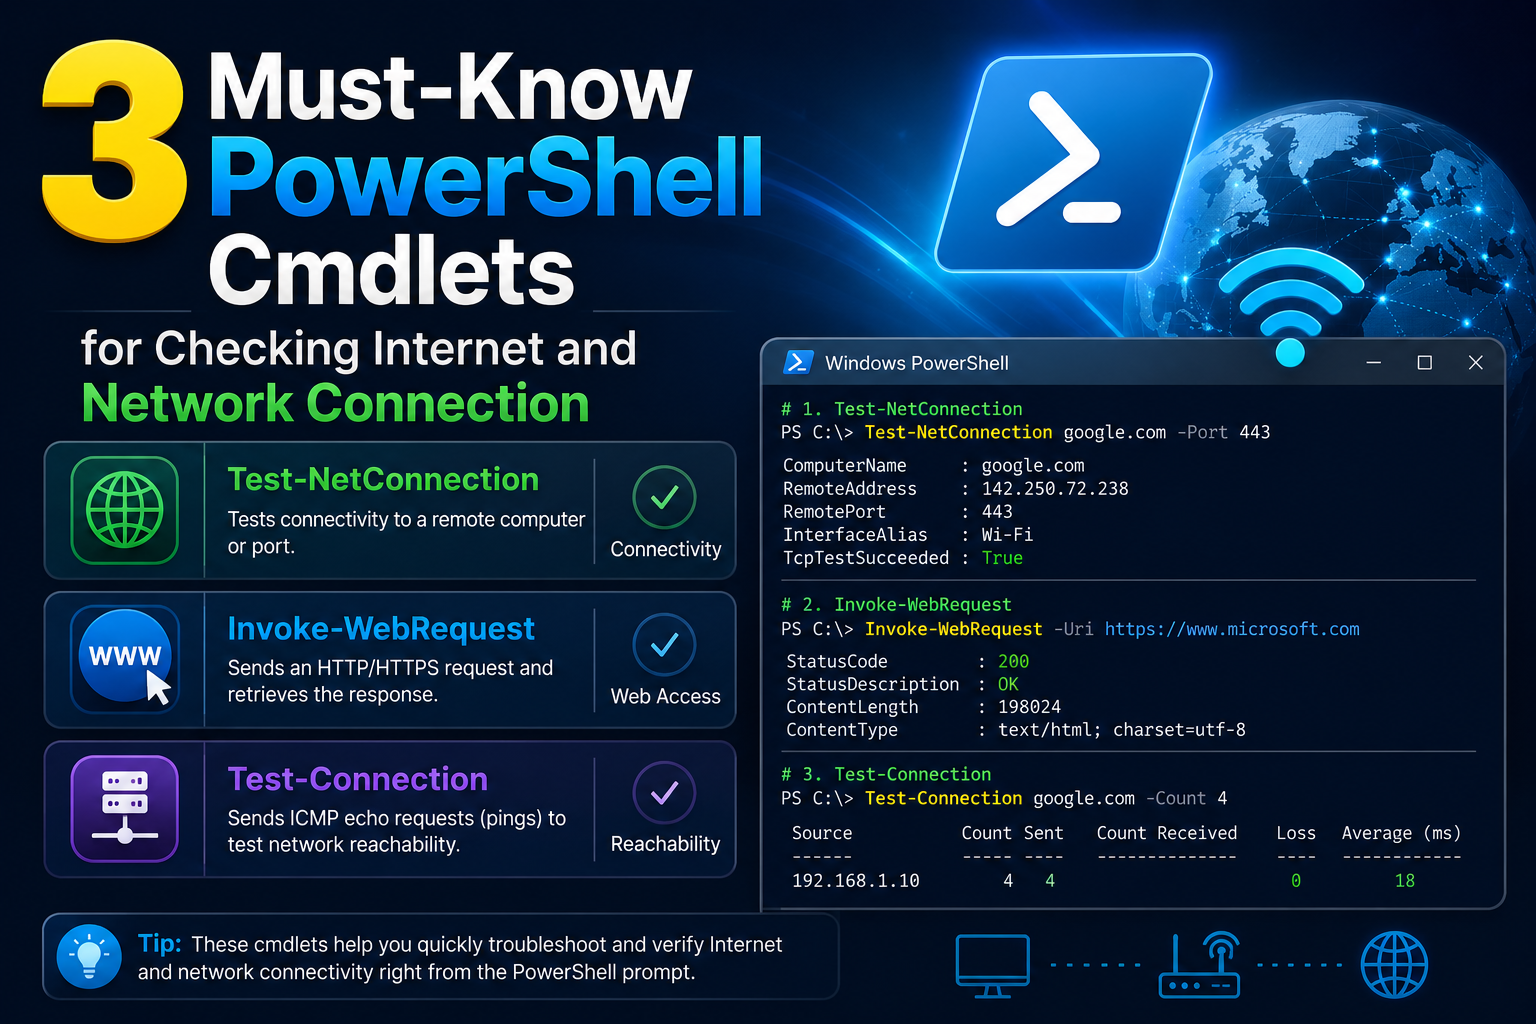
Three foundational cmdlets stand out in this context because they align closely with different stages of communication: adapter-level inspection, network connectivity validation, and object existence verification. Together, they form a practical toolkit that reflects how data moves through a system, from the physical interface to the logical application layer.
The OSI Model as a Mental Framework for Troubleshooting
The OSI model remains one of the most important conceptual tools in networking, even though it is often forgotten in day-to-day administration work. It divides communication into seven distinct layers, each responsible for a specific part of the data exchange process. While modern systems do not always map perfectly to this model, it still provides a powerful mental structure for diagnosing issues.
At the lower layers, physical and data link concerns dominate. These involve cables, wireless signals, network interface cards, and MAC addressing. If something fails at this level, higher layers cannot function at all. Moving upward, the network layer introduces IP addressing and routing logic, which determines how packets travel between devices. The transport layer manages reliability and flow control, ensuring data is delivered properly. Above that, session and presentation layers handle connection persistence and data formatting, while the application layer represents the end-user services and software interactions.
What makes the OSI model particularly useful for administrators is not its theoretical precision, but its ability to narrow down problems. When something breaks, thinking in terms of layers helps isolate where the failure might be occurring. Is the network adapter even active? Is the system able to reach another host? Is the file or resource accessible at the application level?
PowerShell cmdlets map surprisingly well to this layered approach. Instead of manually checking each layer through different tools, administrators can use specific commands that provide targeted information about different parts of the communication chain. This alignment between the conceptual model and the practical toolset is what makes PowerShell so powerful in Windows environments.
Why PowerShell Becomes the Bridge Between Layers
PowerShell is not just a scripting language; it is a management interface that exposes system internals in a structured and consistent way. Unlike traditional command-line utilities that often return unstructured text, PowerShell cmdlets produce objects. These objects contain properties that can be filtered, expanded, and analyzed, allowing administrators to move from raw output to meaningful insight.
This object-based approach is what makes PowerShell particularly effective for networking diagnostics. Instead of simply displaying whether something worked or failed, cmdlets can reveal detailed contextual information about what happened during the operation. This includes interface status, connection details, routing information, and system-level responses.
The real strength of PowerShell lies in its ability to connect different operational layers into a single workflow. An administrator can inspect a network adapter, verify connectivity to a remote host, and validate file system access without switching tools or interfaces. Each cmdlet contributes a different perspective, but all operate within the same environment.
This unified approach is especially valuable in complex environments where issues may not originate from a single source. A failure in a remote application might be caused by something as simple as a disabled network adapter or a missing directory path. Without tools that expose each layer clearly, diagnosing such problems becomes significantly more difficult.
Understanding Network Adapters as the Entry Point to Communication
At the foundation of all network communication lies the network adapter. This component is responsible for sending and receiving data between a computer and the network it is connected to. Whether the connection is wired or wireless, virtual or physical, the adapter acts as the primary gateway for all traffic entering or leaving the system.
From an administrative perspective, understanding the state of network adapters is essential. Many connectivity issues originate at this level, even if they appear to be higher-level problems. An adapter that is disabled, misconfigured, or experiencing driver issues can prevent all forms of communication, regardless of how well other components are functioning.
Inspecting network adapters allows administrators to gather critical information such as interface status, link speed, MAC address, and connection state. These details provide insight into whether the system is physically and logically prepared to communicate on the network. For example, a system may have a valid IP configuration but still fail to communicate if the adapter is disconnected or operating at reduced capacity.
Beyond basic status checks, adapter-level inspection also reveals performance characteristics. Link speed can indicate whether a connection is operating at expected capacity, while media state can show whether the interface is actively connected. These details help differentiate between hardware-level issues and configuration problems.
Understanding this layer is crucial because it represents the entry point of all network communication. If the adapter layer is not functioning correctly, no amount of higher-level troubleshooting will resolve the issue. This is why adapter inspection is often the first step in any structured diagnostic process.
The Role of Connectivity Testing in Multi-Layer Communication
Once the network adapter is confirmed to be functioning, the next step is verifying whether the system can communicate with other devices. This is where connectivity testing becomes essential. At a conceptual level, connectivity testing evaluates whether data can travel between two points in a network.
This process involves multiple layers of the OSI model. At a minimum, it requires the successful operation of the network and transport layers. If these layers are functioning correctly, the system should be able to send and receive basic network messages such as echo requests and responses.
Connectivity testing also provides insight into routing behavior. When a system attempts to reach another host, the data may pass through multiple intermediate devices such as routers and switches. Each of these devices plays a role in forwarding traffic to its destination. If any part of this chain is broken, communication fails.
What makes connectivity testing particularly valuable is its ability to isolate network-level issues from application-level problems. A system may be fully operational locally but unable to reach external resources due to firewall rules, DNS misconfigurations, or routing errors. By testing connectivity directly, administrators can determine whether the issue lies within the network infrastructure or higher-level services.
In addition, connectivity testing often provides response timing information. This can help identify latency issues, packet loss, or unstable connections. These performance indicators are critical in environments where reliability and speed are important.
Understanding Existence Validation at the Application Layer
While network-level diagnostics focus on communication between systems, another important aspect of system administration involves verifying whether specific resources exist. This includes files, directories, registry entries, and configuration paths. At the application layer, the existence of these objects often determines whether software behaves correctly.
Validation at this level is fundamentally different from network testing. Instead of checking communication between systems, it verifies the presence of expected components within a system. This might involve confirming whether a configuration file is present before executing a script or ensuring that a required directory structure exists before deploying an application.
This type of validation is critical in automation scenarios. Scripts that assume the existence of certain files or paths without verifying them can fail unexpectedly. By incorporating existence checks, administrators can create more resilient and predictable workflows.
Another important aspect of existence validation is its hierarchical behavior. When checking a file path, the system implicitly verifies each segment of the path. If any part of the path does not exist, the entire check fails. This makes it a powerful diagnostic tool for identifying missing components in complex directory structures.
Existence validation also extends beyond file systems. It can be applied to system configuration elements such as registry keys. These checks allow administrators to verify whether specific settings have been applied correctly, which is especially useful in configuration management and compliance scenarios.
Mapping PowerShell Cmdlets to OSI Layer Thinking
One of the most effective ways to understand these PowerShell tools is to map them to the OSI model. While not a perfect one-to-one relationship, this mapping helps clarify how each cmdlet interacts with different layers of system communication.
Network adapter inspection primarily aligns with the physical and data link layers. It deals with hardware interfaces, link states, and MAC-level information. Connectivity testing operates at the network and transport layers, focusing on IP communication and data delivery between hosts. Existence validation sits at the application layer, dealing with resources that applications depend on to function correctly.
This layered perspective allows administrators to approach problems systematically. Instead of guessing where an issue might be occurring, they can move through each layer using targeted tools. This reduces troubleshooting time and increases accuracy.
It also reinforces an important principle in system administration: problems rarely exist in isolation. A single user-facing issue may originate from multiple layers of the system stack. Understanding how these layers interact makes it easier to identify root causes rather than symptoms.
Shifting from Reactive to Structured Troubleshooting Mindsets
Perhaps the most important benefit of understanding these PowerShell cmdlets in relation to the OSI model is the shift in mindset they encourage. Instead of reacting to problems as they appear, administrators can adopt a structured approach to troubleshooting.
This involves starting at the lowest possible layer and moving upward, verifying each stage of communication along the way. By doing so, issues are isolated more efficiently, and unnecessary assumptions are avoided. It also reduces reliance on trial-and-error methods that can waste time and introduce additional complexity.
This structured approach is especially valuable in environments with high complexity, such as enterprise networks or hybrid cloud systems. In such environments, multiple systems and services interact simultaneously, making it difficult to identify the source of a problem without a clear methodology.
PowerShell cmdlets serve as practical tools in this methodology. They provide direct access to system information at different layers, allowing administrators to validate assumptions and gather evidence about system behavior.
Deep Diving into Network Adapter Intelligence with Get-NetAdapter
In real-world Windows environments, the network adapter is far more than a simple hardware interface. It is a dynamic control point that reflects both the physical condition of the system and its readiness to participate in network communication. While it may appear static from a user perspective, it is constantly changing state based on driver behavior, cable connectivity, wireless signal strength, virtual switching layers, and system policies.
The PowerShell cmdlet designed to expose this layer provides more than just basic identification details. It serves as a live diagnostic window into how the operating system interprets and manages network interfaces. Each adapter entry represents a structured object that contains multiple properties describing its operational state.
When administrators begin examining adapters in depth, they quickly realize that surface-level information, such as interface name or status, is only a fraction of what is available. Behind those basic indicators lies a rich set of metadata that can reveal subtle issues affecting connectivity.
For example, an adapter may show as operational, yet still suffer from degraded performance due to incorrect driver configuration or mismatched link negotiation. In such cases, higher-level tools might incorrectly suggest that the network is functioning normally. However, adapter-level inspection can expose discrepancies that point directly to the root cause.
This is especially important in virtualized environments, where network adapters may be software-defined rather than physical. Virtual switches, hypervisors, and containerized networking layers can introduce additional abstraction layers that complicate troubleshooting. Understanding the adapter state becomes essential in distinguishing between physical network issues and virtualization-related misconfigurations.
Another critical aspect is the relationship between multiple adapters on a single system. Many modern machines include physical Ethernet ports, wireless interfaces, VPN adapters, and virtual network interfaces created by security or virtualization software. Each of these operates independently but may influence overall connectivity behavior.
By analyzing adapter properties collectively, administrators can determine which interface is actively used for communication, whether failover mechanisms are functioning correctly, and whether traffic is being routed through expected paths. This becomes particularly relevant in systems configured with multiple network gateways or redundant connections.
Interpreting Adapter Properties for Real-World Diagnostics
The true value of adapter inspection lies in interpreting the meaning behind each property. While raw data provides visibility, interpretation transforms that data into actionable insight.
Link state, for example, indicates whether a physical or virtual connection is established. However, a connected state does not necessarily guarantee proper communication. A cable may be physically connected, but the link speed may be reduced due to negotiation failures. Similarly, a wireless adapter may be connected to an access point but be experiencing severe interference.
Interface speed is another important indicator. It reflects the negotiated bandwidth between the system and the connected network device. When this value is lower than expected, it often suggests cabling issues, outdated hardware, or configuration mismatches.
Media state provides additional context about whether the adapter believes it is actively connected. In some cases, this can reveal discrepancies between physical and logical connectivity. For instance, an adapter may report a disconnected state even when a cable is physically attached, pointing to driver or hardware issues.
MAC address information plays a different role in diagnostics. It provides a unique identifier for the network interface, which is essential in environments where network access control or device tracking is enforced. In some troubleshooting scenarios, mismatched or duplicated MAC addresses can lead to unexpected behavior, especially in virtualized systems where MAC spoofing may occur.
Driver information is another critical property often overlooked during basic troubleshooting. Outdated or incompatible drivers can introduce subtle network instability that is difficult to detect without examining adapter-level details. These issues may manifest as intermittent connectivity drops, slow data transfer rates, or failure to establish secure connections.
By interpreting these properties collectively, administrators gain a comprehensive understanding of how the system interacts with the network at its most fundamental level.
Connectivity Testing Beyond Simple Reachability
Connectivity testing is often misunderstood as a simple reachability check. However, modern networking environments require a far more nuanced approach. Communication between systems is influenced by routing policies, firewall rules, domain resolution, and transport-layer behavior.
A connectivity test does more than confirm whether a system is reachable. It evaluates the path between two endpoints and provides insight into how data travels across the network. This includes identifying the source interface, resolving destination addresses, and measuring response behavior.
One of the most valuable aspects of connectivity testing is its ability to differentiate between local and remote issues. If a system cannot reach another host, the problem could originate anywhere between the two endpoints. It might be caused by local configuration issues, intermediate routing failures, or remote system unavailability.
By analyzing diagnostic output, administrators can narrow down the scope of the issue. For example, if a system successfully reaches a remote gateway but fails to communicate with a specific service, the issue is likely beyond basic network connectivity and may involve application-level restrictions.
Connectivity testing also reveals the behavior of intermediate network devices. Firewalls, routers, and load balancers may silently drop or delay traffic based on predefined rules. These behaviors can significantly affect communication without producing obvious error messages.
Another important factor is protocol behavior. Different services rely on different transport protocols, and connectivity testing can help determine whether specific ports or services are accessible. This is particularly useful in environments where security policies restrict traffic based on port numbers or service types.
Understanding Network Paths, Ports, and Latency Behavior
Network communication is rarely direct. Data often travels through multiple hops before reaching its destination. Each hop introduces potential variability in performance and reliability.
Latency is one of the most important indicators of network health. It represents the time taken for data to travel between the source and the destination. While low latency is expected in local networks, higher latency may be acceptable in wide-area or internet-based communication. However, unexpected spikes in latency can indicate congestion, routing inefficiencies, or hardware limitations.
Packet loss is another critical factor. Even small amounts of packet loss can significantly impact application performance, especially for real-time services. Connectivity diagnostics can reveal whether packet transmission is stable or experiencing degradation.
Port-level analysis adds another dimension to connectivity testing. Many applications rely on specific ports to function correctly. If these ports are blocked or unavailable, communication fails even if basic network connectivity is intact. Understanding port behavior is essential for diagnosing service-specific issues.
In enterprise environments, port filtering is often enforced through firewalls and security appliances. These devices control traffic based on organizational policies, which means that connectivity may vary depending on source, destination, and protocol.
By combining path analysis, latency measurement, and port validation, administrators can gain a detailed understanding of how data flows through the network.
Using Existence Validation in Automation Workflows
File and resource validation plays a critical role in automation. Many scripts and workflows depend on the existence of specific files, directories, or configuration elements. Without proper validation, automation processes can fail unpredictably.
Existence checks provide a safeguard against such failures by ensuring that required components are present before operations proceed. This allows workflows to adapt dynamically based on system state.
In automated deployment scenarios, for example, validation can be used to confirm that installation directories exist before copying files. In configuration management, it can ensure that required registry keys are present before applying settings.
One of the key strengths of existence validation is its simplicity. It does not require complex logic or external dependencies. Instead, it provides a straightforward answer to a fundamental question: whether a resource is available or not.
Despite its simplicity, this type of validation can significantly improve reliability. Many system failures occur not because of complex errors, but because of missing prerequisites. By verifying these prerequisites in advance, administrators can prevent cascading failures.
Existence validation also supports conditional execution. Depending on whether a resource is present, different actions can be taken. This allows scripts to adapt to different system states without manual intervention.
Bridging File System Logic with Network Resources
Although file systems and network systems may appear unrelated, they often intersect in practical administration tasks. Network shares, remote directories, and distributed storage systems blur the line between local and remote resources.
When validating file paths that point to network locations, multiple layers of communication are involved. The system must first resolve the network address, establish a connection, and then access the requested resource. Each of these steps introduces potential points of failure.
A file path that appears valid syntactically may still fail due to network issues, authentication problems, or permission restrictions. Existence validation helps identify whether the issue lies in the path structure or in the underlying network connectivity.
This becomes particularly important in environments where shared resources are heavily used. File servers, cloud storage gateways, and distributed file systems all rely on consistent network communication. If any part of the connection chain fails, resource access is interrupted.
By combining file system validation with network diagnostics, administrators can distinguish between local path issues and remote connectivity problems. This reduces troubleshooting time and improves accuracy.
Combining Cmdlets into Layered Troubleshooting Strategies
The true power of these PowerShell tools emerges when they are used together as part of a structured troubleshooting approach. Rather than treating each cmdlet as an isolated utility, they can be combined to form a layered diagnostic strategy.
This approach mirrors the structure of network communication itself. At the lowest level, network adapters confirm hardware readiness. At the intermediate level, connectivity tests verify communication pathways. At the higher level, existence validation ensures that required resources are available for applications.
By moving through these layers systematically, administrators can isolate problems more efficiently. If adapter inspection reveals no issues, attention shifts to connectivity. If connectivity is stable, focus moves to resource validation.
This layered approach reduces guesswork and eliminates unnecessary assumptions. It also ensures that troubleshooting follows a logical progression rather than random testing.
In complex environments, this methodology becomes even more valuable. Systems may depend on multiple interconnected services, each introducing potential points of failure. A structured approach ensures that each layer is evaluated independently.
PowerShell Objects and Why Structured Output Matters
One of the defining characteristics of PowerShell is its object-based output model. Unlike traditional command-line tools that produce plain text, PowerShell returns structured objects that contain multiple properties.
This structure allows administrators to interact with data in a more meaningful way. Instead of parsing text manually, they can directly access relevant properties and build logic around them.
Structured output also improves consistency. Because each cmdlet returns predictable object types, scripts can be designed to handle results reliably across different systems.
In networking diagnostics, this is particularly important. Adapter information, connectivity results, and validation outputs all contain structured data that can be compared, filtered, and analyzed.
This enables advanced automation scenarios where decisions are made based on system state. For example, scripts can automatically trigger remediation actions if connectivity fails or if required resources are missing.
The object-based model transforms PowerShell from a simple command interface into a powerful automation platform capable of handling complex system interactions.
Error Patterns and Misleading Symptoms in Windows Networking
One of the most challenging aspects of network troubleshooting is dealing with misleading symptoms. Not all errors point directly to their root cause. In many cases, the visible issue is only a secondary effect of a deeper problem.
For example, a user may experience slow application performance and assume that the application itself is faulty. However, the underlying cause might be network latency, adapter misconfiguration, or missing file resources.
Similarly, connectivity failures may appear to be network-related but are actually caused by DNS misconfiguration or firewall restrictions. Without proper diagnostic tools, these distinctions are difficult to identify.
PowerShell cmdlets help reduce ambiguity by providing detailed system information. Instead of relying on error messages alone, administrators can examine the actual state of system components.
This helps distinguish between true failures and symptoms caused by indirect issues. It also reduces the risk of applying incorrect fixes that do not address the root cause.
By understanding common error patterns and how they manifest across different layers, administrators can approach troubleshooting with greater precision and confidence.
Advanced Connectivity Validation in Complex Windows Environments
In modern enterprise systems, network communication is rarely simple or linear. What appears to be a straightforward request between two machines is often the result of multiple hidden processes working together across different layers of infrastructure. Firewalls, proxy servers, DNS systems, load balancers, virtual switches, and security policies all participate in shaping how data moves from one endpoint to another.
PowerShell plays a critical role in making these invisible processes visible. While traditional monitoring tools often provide high-level summaries, PowerShell cmdlets allow administrators to break down communication into measurable, inspectable components. This is particularly important when troubleshooting intermittent issues that do not consistently reproduce or when systems behave differently under varying network conditions.
Connectivity validation in such environments must go beyond simple reachability checks. A system may respond successfully to a basic request but still fail under real application load or when specific ports are involved. This difference is often the reason why simple diagnostic methods fail to reveal the true source of a problem.
In complex environments, connectivity is influenced not only by physical network conditions but also by logical rules enforced across multiple layers. Security policies may restrict traffic based on identity, location, or protocol type. Routing rules may redirect traffic through alternative paths depending on load or availability. Even application-layer gateways may inspect and modify traffic before it reaches its destination.
Understanding this complexity requires tools that can expose different aspects of communication behavior. PowerShell cmdlets designed for network diagnostics provide this visibility by returning structured information that reflects how the system perceives and interacts with the network.
Interpreting Multi-Layer Network Behavior in Real Time
One of the most powerful aspects of PowerShell-based diagnostics is the ability to observe network behavior in real time. Unlike static logs or historical reports, real-time diagnostics allow administrators to see how systems respond at the moment an action is executed.
This is especially useful in environments where network conditions fluctuate. For example, wireless networks may experience interference at unpredictable intervals. Cloud-based services may experience latency spikes due to regional load distribution. Virtualized environments may introduce delays caused by resource contention.
Real-time connectivity testing helps identify these patterns by providing immediate feedback on each attempt to communicate with a remote system. This allows administrators to correlate system behavior with external conditions, making it easier to identify root causes.
Another important aspect of real-time analysis is the ability to observe consistency. A single successful connection does not guarantee stable communication. Repeated tests may reveal intermittent failures, delayed responses, or inconsistent routing paths.
By analyzing these patterns, administrators can distinguish between stable and unstable network conditions. This is particularly important in mission-critical environments where even short disruptions can impact business operations.
Understanding Source and Destination Mapping in Network Communication
Every network interaction involves a source and a destination. While this may seem straightforward, the underlying process of mapping these endpoints is complex and dynamic. The system must determine which interface to use, which route to follow, and how to translate logical names into physical addresses.
DNS resolution plays a central role in this process. When a hostname is used instead of an IP address, the system must query DNS servers to determine the correct destination. This introduces additional dependency layers that can affect communication reliability.
PowerShell-based connectivity diagnostics often reveal both the resolved destination and the source interface used for communication. This information is essential when troubleshooting multi-homed systems that have multiple network interfaces.
In such systems, traffic may be routed through different interfaces depending on routing metrics or configuration rules. This can lead to unexpected behavior, especially if certain interfaces are restricted or optimized for specific types of traffic.
Understanding source and destination mapping helps administrators ensure that communication follows the intended path. It also helps identify situations where traffic is being routed inefficiently or through unintended channels.
The Role of Time-to-Live and Path Traversal in Diagnostics
Network communication is not just about whether a connection succeeds or fails. It is also about how data travels between endpoints. Each packet has a limited lifespan defined by its time-to-live (TTL) value, which determines how many hops it can traverse before being discarded.
TTL behavior is an important diagnostic indicator because it reveals how many intermediate devices are involved in communication. A higher number of hops typically indicates a more complex or indirect route.
In troubleshooting scenarios, analyzing path traversal helps identify routing inefficiencies or unexpected network paths. If data is traveling through an excessive number of hops, it may indicate suboptimal routing configurations or misconfigured network devices.
TTL-based analysis also helps detect routing loops or misdirected traffic. If packets are repeatedly circulating without reaching their destination, TTL values will eventually expire, indicating a problem in the routing configuration.
Although PowerShell does not directly visualize network topology, connectivity diagnostics often expose indirect evidence of path behavior. By analyzing response patterns and timing behavior, administrators can infer how data is being routed across the network.
Deepening Understanding of Transport Layer Behavior
The transport layer is responsible for ensuring reliable communication between systems. It manages how data is segmented, transmitted, and reassembled. Two primary protocols operate at this layer: TCP and UDP.
TCP provides reliable, connection-oriented communication. It ensures that data is delivered in order and retransmitted if lost. UDP, on the other hand, provides faster but less reliable communication, often used for real-time applications where speed is more important than guaranteed delivery.
Understanding transport layer behavior is essential when diagnosing application issues. Some services require stable TCP connections, while others rely on UDP for performance.
Connectivity diagnostics can help determine whether specific ports are accessible using the expected protocol. If a service is unreachable, it may be due to blocked ports, protocol mismatches, or firewall restrictions.
Transport layer issues are often subtle because they may not completely block communication. Instead, they may degrade performance or cause intermittent failures that are difficult to reproduce.
By examining transport layer behavior, administrators can determine whether communication issues are caused by infrastructure problems or application-level constraints.
File System Dependencies in Networked Environments
In many enterprise environments, file systems are not isolated to individual machines. Instead, they are distributed across network shares, cloud storage systems, and synchronized directories. This creates dependencies between file system availability and network connectivity.
When a system attempts to access a remote file, multiple processes are involved. First, the system must resolve the network location. Then it must establish a connection to the file server. Finally, it must verify permissions and access the requested resource.
Each of these steps introduces potential points of failure. A missing file may not necessarily indicate that the file was deleted. It may simply indicate that the system was unable to reach the file server.
This is why existence validation plays such an important role in troubleshooting. It helps distinguish between missing resources and inaccessible resources.
In distributed environments, file paths often represent logical abstractions rather than physical locations. A single network share may be backed by multiple storage systems or replicated across different regions. This complexity makes it essential to validate both path structure and accessibility.
By combining file validation with network diagnostics, administrators can gain a clearer understanding of where failures originate.
Conditional Logic and Decision-Making in Automation Scripts
Automation is one of the most powerful applications of PowerShell. However, automation is only as reliable as the logic that drives it. Conditional statements based on system state allow scripts to adapt dynamically to different environments.
Existence validation plays a key role in this decision-making process. By checking whether a resource exists before acting on it, scripts can avoid unnecessary errors and handle exceptions gracefully.
For example, a script that deploys software may first verify whether the installation directory exists. If it does not, the script can create it before proceeding. Similarly, network scripts may verify connectivity before attempting remote operations.
This approach reduces failure rates and improves predictability. It also allows scripts to be reused across different environments without requiring manual adjustments.
Conditional logic also enables branching behavior. Depending on the system state, different actions can be executed. This makes automation more flexible and adaptable.
Layered Dependency Failures in Real Systems
One of the most challenging aspects of system administration is dealing with layered dependency failures. These occur when multiple system components fail in sequence or in combination, making it difficult to identify the original cause.
For example, a user may be unable to access a network file. The root cause might involve a combination of DNS failure, network adapter misconfiguration, and missing file permissions. Each layer contributes to the final failure.
Without structured diagnostics, these issues can appear random or unrelated. However, by examining each layer independently, administrators can reconstruct the sequence of events that led to the failure.
PowerShell cmdlets provide the tools needed to perform this layered analysis. By checking adapter status, connectivity, and resource availability separately, administrators can isolate each stage of the communication process.
This method reduces ambiguity and helps prevent misdiagnosis. It also ensures that fixes address the actual root cause rather than surface-level symptoms.
Performance Degradation and Hidden Network Constraints
Not all network issues result in complete failure. In many cases, systems continue to function but at reduced performance levels. These issues are often more difficult to detect because they do not trigger obvious error messages.
Performance degradation can be caused by a wide range of factors, including bandwidth limitations, congestion, hardware limitations, or inefficient routing paths. It can also result from application-level constraints such as inefficient resource handling or excessive retries.
Connectivity diagnostics that include timing information are particularly useful in identifying these issues. By measuring response times and analyzing variability, administrators can detect instability even when communication remains technically functional.
This type of analysis is essential in environments where performance consistency is critical. Small delays or fluctuations can have significant impacts on user experience or system reliability.
Security Layers and Their Impact on Connectivity
Security systems play an increasingly important role in shaping network communication. Firewalls, intrusion detection systems, and endpoint protection tools all influence how data flows between systems.
These systems often operate transparently, making it difficult to detect their impact using basic diagnostic tools. A connection may fail silently due to security policies without producing clear error messages.
Understanding security layers is essential when diagnosing connectivity issues. Some systems may block traffic based on application behavior, while others may inspect packet contents before allowing communication.
PowerShell-based diagnostics can help identify whether security systems are interfering with communication by revealing patterns such as consistent timeouts or selective failures.
In complex environments, security policies may differ between network segments. This can lead to inconsistent behavior depending on where a system is located or how it is connected.
Conclusion
Modern Windows environments are built on layers of abstraction that make day-to-day administration both easier and more complex at the same time. While graphical interfaces and automated platforms simplify many tasks, they also hide the underlying systems that determine how communication actually works. When issues arise, this hidden complexity becomes visible very quickly, often in the form of connectivity failures, slow performance, or unpredictable system behavior.
PowerShell provides a direct and structured way to look beneath these abstractions. Instead of relying on surface-level indicators, administrators can interact with the system in a way that reflects how it truly operates internally. The three cmdlets discussed—network adapter inspection, connectivity testing, and existence validation—represent different layers of this internal structure. Each one offers a distinct perspective on system health, and together they form a practical framework for understanding and troubleshooting Windows environments.
Network adapter inspection focuses on the foundation of communication. It reveals whether the system is physically and logically prepared to participate in a network. Without a properly functioning adapter, no higher-level communication can occur. This makes it the natural starting point for any diagnostic process.
Connectivity testing extends this view into the network itself. It evaluates whether systems can communicate across interfaces, routes, and intermediate devices. It exposes issues that may not be visible at the local level, such as routing failures, firewall restrictions, or DNS-related problems. It also helps distinguish between local and remote causes of failure, which is essential in distributed environments.
Existence validation operates at a different layer entirely, focusing on whether required resources are available for applications and processes. It ensures that files, directories, registry keys, or configuration elements exist before they are used. This simple check plays a critical role in automation and system reliability, preventing failures that occur due to missing prerequisites or incorrect assumptions.
When combined, these cmdlets reflect a layered troubleshooting strategy that closely aligns with the OSI model. Instead of treating issues as isolated incidents, administrators can approach problems systematically, moving from physical connectivity to logical validation. This structured approach reduces uncertainty, improves diagnostic accuracy, and speeds up resolution times.
In complex enterprise environments, where systems are interconnected and dependencies are widespread, this layered thinking becomes even more valuable. A single issue may span multiple levels of the stack, and only by examining each layer individually can the true cause be identified. PowerShell makes this process practical by providing tools that expose each layer in a clear and actionable way.
Ultimately, mastering these foundational cmdlets is not just about learning commands. It is about developing a deeper understanding of how systems communicate and how failures propagate through different layers. This understanding transforms troubleshooting from a reactive task into a structured, analytical process.