The modern digital workplace depends heavily on stable connectivity, fast application performance, and reliable access to cloud services. Yet, despite increasingly advanced infrastructure, users still experience slow applications, dropped connections, and inconsistent performance. These problems are often difficult to trace because they may originate outside traditional enterprise networks, such as within internet service providers, cloud platforms, or intermediate routing paths.
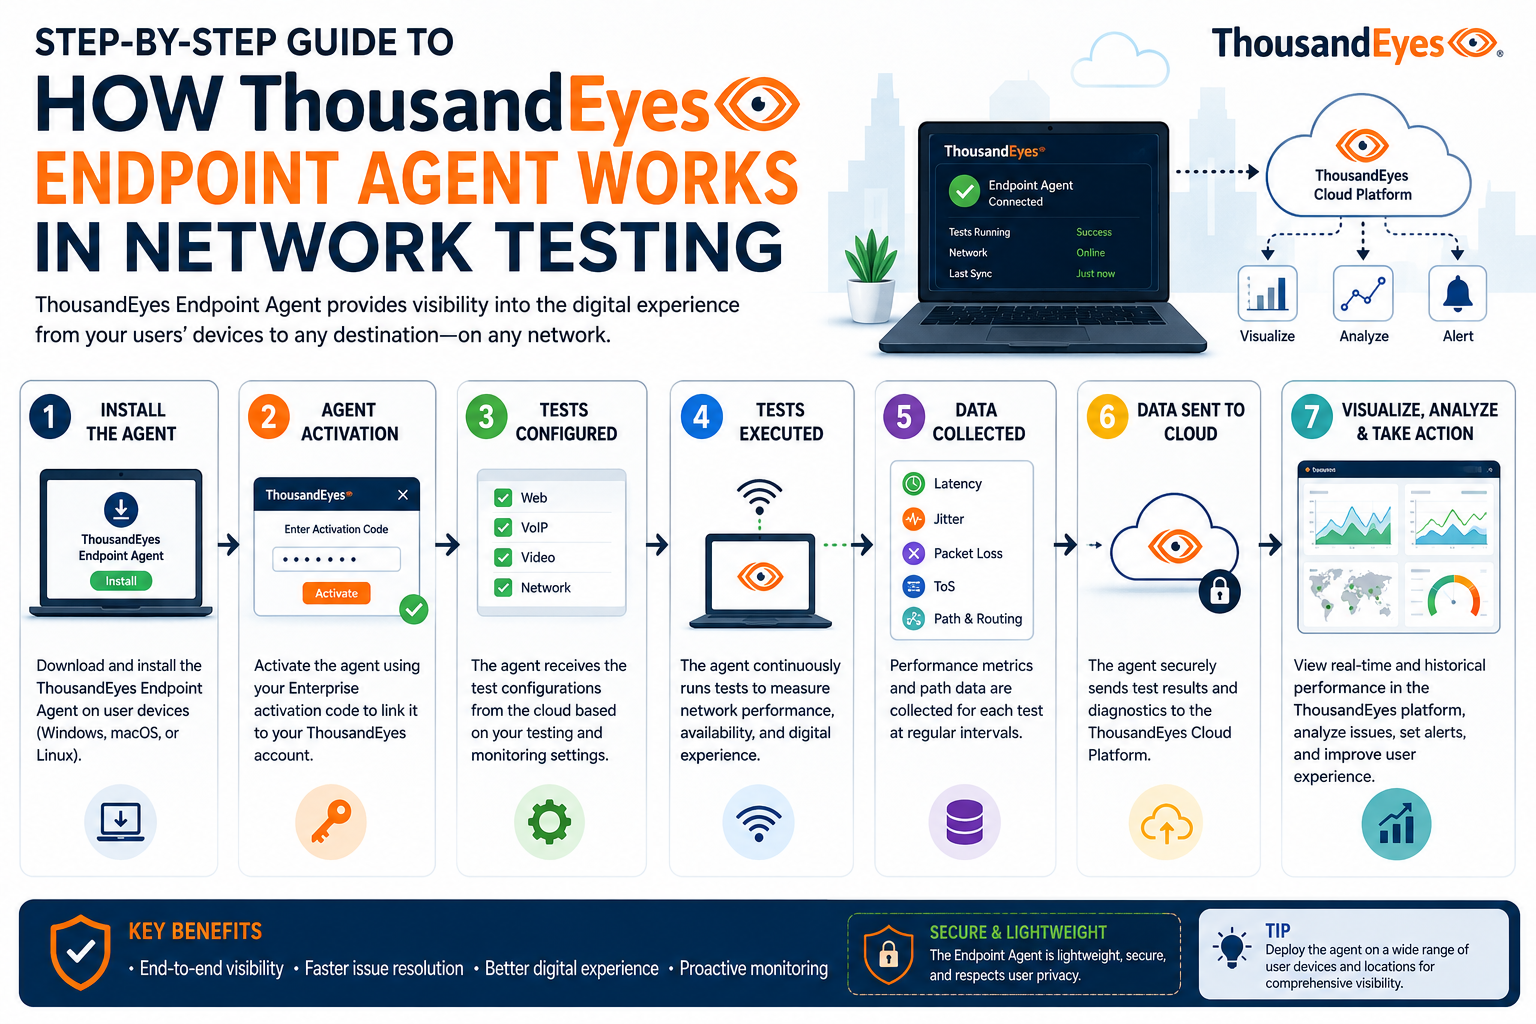
This is where the concept of end-user-focused network monitoring becomes important. The ThousandEyes Endpoint Agent, developed by ThousandEyes, is designed to observe network and application performance exactly as users experience it. Instead of relying only on infrastructure-level metrics like server health or router performance, it shifts visibility directly to the user’s device.
The agent is installed on endpoints such as laptops and desktops running common operating systems like Windows and macOS. Once installed, it quietly gathers performance data related to how applications behave in real-world usage conditions. This includes network responsiveness, connection stability, and the quality of communication between the user and online services.
What makes this approach powerful is that it captures problems that traditional monitoring tools often miss. For example, a server may appear fully operational, but users might still experience delays due to congestion in external networks. The Endpoint Agent helps identify such gaps by continuously observing the path between the user and the application.
How the Endpoint Agent Collects and Interprets Network Data
At its core, the ThousandEyes Endpoint Agent functions as a data collection and analysis tool that focuses on network behavior from the endpoint’s perspective. Once active on a device, it begins monitoring various signals that reflect the quality of connectivity and application performance.
One of the key categories of data it collects is latency, which refers to the time it takes for data to travel between the user and a destination server. Even small increases in latency can significantly impact real-time applications such as video conferencing or cloud-based collaboration tools.
Another important metric is packet loss. This occurs when data packets fail to reach their destination, leading to incomplete or disrupted communication. Packet loss can cause visible issues such as frozen video calls, missing audio, or slow-loading applications.
Bandwidth usage is also measured to understand how much data is being transmitted over a network connection at any given time. This helps identify whether performance issues are caused by congestion or resource limitations on the network.
The agent also observes jitter, which refers to variations in latency over time. High jitter can make network performance feel unstable, even if average latency appears acceptable. These subtle variations are often difficult to detect without endpoint-level monitoring.
All collected data is transmitted to a centralized analysis platform, where it is processed and correlated with broader network intelligence. This allows IT teams to view not just isolated metrics but patterns that reveal underlying causes of performance issues.
End-User Perspective as a Core Monitoring Approach
Traditional network monitoring tools often focus on infrastructure components such as servers, routers, and switches. While this approach is useful for maintaining system health, it does not always reflect what users actually experience.
The Endpoint Agent changes this perspective by prioritizing the user’s viewpoint. Instead of asking whether a server is functioning correctly, it asks whether the user can successfully and efficiently reach the application they need.
This shift is important because many modern applications rely on distributed systems. A single service may depend on cloud providers, third-party APIs, content delivery networks, and external authentication systems. A problem in any one of these components can degrade performance for the end user.
By operating directly on user devices, the agent is able to observe real-time interactions with applications. This includes how long it takes to load pages, how stable connections remain during active sessions, and whether external dependencies introduce delays.
The result is a more accurate understanding of digital experience quality. Instead of guessing where a problem might be occurring, IT teams can see precisely how performance issues manifest from the user’s perspective.
Network Path Analysis and Visibility Across the Internet
One of the most valuable capabilities of the Endpoint Agent is its ability to analyze network paths. Every time a user connects to an application, data travels through multiple intermediate points before reaching its destination. These points may include local networks, internet service providers, cloud infrastructure, and global routing systems.
The agent maps this journey to identify where delays or failures occur. This process is known as network path visualization. It allows IT teams to see each step of the connection route and understand how data flows across different segments of the internet.
If a problem arises, such as increased latency or packet loss, the visualization helps pinpoint the exact stage where the issue is occurring. This is particularly useful when problems exist outside the organization’s direct control, such as within external networks or third-party providers.
In many cases, network issues are not caused by a single failure but by a combination of small inefficiencies across multiple points. Path analysis helps reveal these hidden patterns by providing a structured view of the entire communication route.
This level of visibility is especially important in cloud-based environments, where applications may be hosted across multiple regions and depend on global infrastructure. Without endpoint-level insight, diagnosing such issues can become extremely complex and time-consuming.
Application Performance Monitoring from Real User Activity
Beyond network diagnostics, the Endpoint Agent also focuses on application performance. Modern applications are highly interactive and depend on continuous communication between client devices and backend systems.
The agent monitors how applications behave during real user sessions. This includes tracking how quickly pages load, how responsive interfaces are, and how smoothly data is exchanged between systems.
Unlike synthetic testing, which simulates user behavior in controlled environments, real user monitoring captures actual performance conditions. This means it reflects real-world challenges such as unstable Wi-Fi connections, congested networks, or regional internet slowdowns.
By analyzing this data, IT teams can identify whether performance issues are caused by the application itself or by external network conditions. This distinction is critical for efficient troubleshooting because it determines whether developers, network engineers, or service providers need to be involved.
The agent also helps detect performance inconsistencies that may only affect certain users or regions. For example, an application might perform well in one geographic location but experience delays in another due to routing inefficiencies.
This granular level of insight allows organizations to optimize both application design and infrastructure deployment strategies.
Deployment and Operation Across Diverse Environments
The Endpoint Agent is designed to operate in a wide range of environments without disrupting user activity. Once installed on a device, it runs in the background and continuously collects performance data without requiring manual intervention.
Deployment can be carried out across large fleets of devices, making it suitable for organizations with distributed workforces. Whether employees are working from offices, remote locations, or hybrid setups, the agent maintains consistent monitoring capabilities.
One of its key strengths is adaptability. It can function across different network types, including wired connections, wireless networks, and mobile hotspots. This ensures that performance data remains reliable even when users switch between different environments.
The centralized management system allows administrators to configure monitoring policies, adjust data collection parameters, and oversee all active agents from a single interface. This reduces operational complexity and ensures consistent monitoring standards across the organization.
Because it is lightweight and non-intrusive, the agent does not significantly impact device performance. This makes it suitable for continuous operation without interfering with user productivity.
Role in Identifying Hidden Connectivity and Infrastructure Issues
Many network problems are not immediately visible through standard monitoring tools. Issues such as intermittent packet loss, routing inefficiencies, or third-party service disruptions often go undetected until users begin reporting performance problems.
The Endpoint Agent plays a critical role in uncovering these hidden issues. By continuously collecting data at the endpoint level, it provides early indicators of potential disruptions before they escalate into widespread outages.
For example, a sudden increase in latency might indicate congestion within a specific internet service provider’s network. Similarly, inconsistent application loading times might point to problems in cloud service routing.
Because the agent captures both network and application-level data, it can correlate symptoms with underlying causes more effectively. This reduces the time required to diagnose issues and helps organizations respond more quickly to performance degradation.
In complex digital ecosystems, where multiple services depend on each other, this level of visibility is essential for maintaining reliability and user satisfaction.
Continuous Evolution of Endpoint-Based Network Intelligence
As digital systems continue to evolve, the importance of endpoint-based monitoring is becoming increasingly significant. Applications are no longer confined to internal servers; they are distributed across cloud environments, external APIs, and global networks.
The Endpoint Agent reflects this shift by focusing on real-world performance rather than isolated infrastructure metrics. It bridges the gap between user experience and network engineering by providing a unified view of both domains.
This approach allows organizations to move beyond reactive troubleshooting and toward proactive performance management. Instead of responding to issues after they occur, IT teams can identify early warning signs and address them before users are affected.
The increasing complexity of modern networks ensures that endpoint-level visibility will continue to play a central role in digital performance management strategies.
Advanced Architecture Behind the ThousandEyes Endpoint Agent
To understand the true strength of the ThousandEyes Endpoint Agent, it is important to look beyond its surface-level monitoring capabilities and explore how it is structured internally. The system is designed around a distributed intelligence model, where data is collected at the edge—on user devices—and then analyzed centrally to produce meaningful insights.
At the endpoint level, the agent operates as a lightweight service embedded within the user’s operating system. It does not function as a traditional network scanner or traffic interceptor. Instead, it passively observes and actively tests connectivity conditions based on predefined measurement rules.
Once installed, the agent establishes a secure communication channel with the cloud-based analysis platform operated by ThousandEyes. This channel ensures that all telemetry data is transmitted safely without exposing sensitive user information or interfering with normal network traffic.
The architecture is designed to scale across thousands or even millions of endpoints. Each device contributes small pieces of performance data, which are aggregated into a global intelligence model. This distributed approach allows organizations to observe network behavior across different regions, ISPs, and cloud environments simultaneously.
Rather than relying on a single monitoring point, the system builds a multi-perspective view of network health. This means that the same application can be observed from different geographic locations and network conditions, revealing inconsistencies that would otherwise remain hidden.
Synthetic Testing and Real-World Measurement Fusion
One of the most powerful aspects of the Endpoint Agent is its ability to combine synthetic testing with real user monitoring. These two approaches work together to create a complete picture of network and application performance.
Synthetic testing involves simulated requests generated by the agent to measure how applications respond under controlled conditions. These tests are run at regular intervals and help establish baseline performance expectations. For example, the agent may simulate a login request or page load to measure response time under ideal conditions.
In contrast, real user monitoring captures actual user interactions as they happen. This includes real browsing sessions, application usage, and background network activity. It reflects unpredictable conditions such as fluctuating Wi-Fi strength, device limitations, or regional internet congestion.
By combining both datasets, the system can distinguish between theoretical performance and actual user experience. If synthetic tests show normal performance but real users experience delays, the issue likely lies in external network conditions rather than the application itself.
This dual-layer approach is essential for modern cloud-based environments where applications behave differently depending on network routes, device types, and user locations. It ensures that IT teams are not relying on incomplete or misleading performance indicators.
Deep Packet-Level Insights Without Intrusive Monitoring
A key challenge in network monitoring is balancing visibility with privacy. Traditional packet inspection methods often require deep access to network traffic, which can raise concerns about user data exposure.
The Endpoint Agent addresses this challenge by focusing on metadata rather than full packet inspection. Instead of capturing the contents of user communications, it analyzes performance-related characteristics such as timing, response delays, and routing behavior.
This allows it to identify issues such as slow DNS resolution, inefficient routing paths, or unstable connections without accessing sensitive application content. As a result, organizations can maintain strong visibility into network performance while preserving user privacy.
The agent also avoids disrupting encrypted traffic. In modern environments where most communication is secured using TLS encryption, monitoring tools mustn’t interfere with security protocols. The Endpoint Agent is designed to observe encrypted sessions without decrypting their content, focusing instead on performance indicators.
This approach ensures compliance with modern privacy standards while still providing meaningful diagnostic insights. It reflects a shift in network monitoring philosophy—from content inspection to behavior analysis.
Troubleshooting Complex Cloud and Hybrid Environments
Modern enterprise networks are rarely confined to a single physical location. Instead, they span on-premises infrastructure, multiple cloud providers, and third-party services. This creates a highly complex environment where performance issues can originate from many different sources.
The Endpoint Agent plays a critical role in simplifying troubleshooting in these hybrid environments. Capturing data directly from the user’s device, it provides a consistent reference point across all network layers.
For example, if a cloud-hosted application becomes slow, the agent can determine whether the issue is caused by the local network, the internet service provider, or the cloud infrastructure itself. This eliminates guesswork and reduces the time required to isolate the root cause.
In multi-cloud environments, where applications may be distributed across platforms like AWS, Azure, or private cloud systems, this visibility becomes even more important. Each platform introduces its own routing behavior and performance characteristics, which can interact in unpredictable ways.
The agent helps unify these perspectives by standardizing how performance data is collected and interpreted. This allows IT teams to compare performance across different environments using a consistent measurement framework.
Understanding Internet-Level Failures and External Dependencies
Not all network problems originate within an organization’s infrastructure. In many cases, issues occur within external networks that are outside direct administrative control. These include internet service providers, regional backbone networks, and third-party hosting services.
The Endpoint Agent is particularly effective at identifying these external dependencies. By mapping the full network path between the user and the application, it can pinpoint where performance degradation occurs outside the enterprise boundary.
For instance, if users in a specific region experience slow access to a cloud application, the agent may reveal that the delay is caused by congestion within a regional ISP rather than the application itself. This level of insight is crucial for organizations operating globally.
It also helps reduce misdiagnosis. Without endpoint-level visibility, external network issues might be mistakenly attributed to internal systems, leading to unnecessary troubleshooting efforts.
By clearly distinguishing between internal and external causes, the agent improves collaboration between organizations and service providers. It provides evidence-based diagnostics that can be shared when escalating issues to external parties.
Security Monitoring and Behavioral Risk Awareness
Although the Endpoint Agent is primarily designed for performance monitoring, it also contributes indirectly to security awareness. By observing network behavior patterns, it can detect unusual changes in connectivity that may indicate underlying risks.
For example, sudden shifts in routing paths or unexpected increases in latency may suggest network instability or unauthorized interference. While the agent does not function as a security intrusion detection system, its performance data can support broader security investigations.
Organizations often use this information alongside security monitoring tools to gain a more complete understanding of system behavior. When combined with other data sources, it can help identify anomalies that warrant further investigation.
Another important aspect of its design is controlled data collection. The agent is built to focus on network performance rather than user content or personal activity. This reduces the risk of privacy violations and ensures that monitoring remains aligned with operational needs.
Security policies can also be configured to define how data is collected and transmitted. This allows organizations to maintain governance over monitoring activities while still benefiting from detailed network insights.
Integration Across Enterprise Monitoring Ecosystems
In modern IT environments, no single tool operates in isolation. Network monitoring systems must integrate with broader observability platforms, incident management systems, and operational dashboards.
The Endpoint Agent is designed with integration in mind. It can feed performance data into centralized monitoring ecosystems, allowing organizations to correlate network metrics with application logs, infrastructure alerts, and user feedback systems.
This integration enables faster incident response workflows. When performance issues are detected, alerts can be automatically generated and routed to relevant teams based on predefined rules.
For example, a network latency issue affecting a specific region can be automatically assigned to the appropriate network operations team, while application-level delays may be directed to development teams.
This structured approach reduces response times and ensures that issues are handled by the right specialists. It also improves coordination across departments, which is essential in large-scale enterprise environments.
Real-Time Observability and Continuous Feedback Loops
One of the defining characteristics of modern network monitoring is real-time observability. The Endpoint Agent contributes to this by continuously collecting and transmitting performance data as users interact with systems.
This creates a continuous feedback loop between user experience and system performance. Instead of relying on periodic reports or manual diagnostics, organizations receive ongoing insights into network behavior.
This real-time visibility allows IT teams to detect performance degradation as it happens, rather than after users have already been impacted. It also enables proactive optimization, where adjustments can be made before issues escalate.
Over time, this continuous data stream helps build historical performance models. These models can be used to identify trends, predict future issues, and optimize infrastructure planning.
By combining real-time monitoring with long-term analytics, organizations gain both immediate awareness and strategic insight into their network environments.
Scalability in Large-Scale Digital Ecosystems
As organizations grow, their network environments become increasingly complex. They may span multiple continents, support remote workforces, and rely on dozens of interconnected services.
The Endpoint Agent is built to scale in such environments. Its distributed architecture allows it to operate efficiently across large numbers of devices without overwhelming network resources or centralized systems.
Each agent operates independently on its host device, collecting only relevant performance data. This decentralized approach ensures that monitoring remains efficient even as the number of endpoints increases.
The centralized analysis system is designed to handle large volumes of incoming data, aggregating and correlating it into meaningful insights. This ensures that scalability does not compromise performance or accuracy.
In large enterprises, this scalability is essential for maintaining consistent visibility across all users and locations. It ensures that no part of the network becomes a blind spot.
Evolving Role in Digital Experience Management
The role of network monitoring is shifting from infrastructure maintenance to digital experience management. Organizations are no longer just concerned with whether systems are operational, but whether users are experiencing high-quality interactions.
The Endpoint Agent supports this shift by focusing on user-centric performance metrics. Instead of measuring isolated system health indicators, it evaluates how users actually experience applications in real time.
This includes responsiveness, stability, and consistency across different environments. It also helps identify variations in experience caused by geography, device type, or network conditions.
As digital services continue to expand, this focus on experience becomes increasingly important. Users expect fast, reliable access to applications regardless of where they are located or what network they are using.
By providing detailed insight into real-world performance, the Endpoint Agent plays a central role in helping organizations meet these expectations in complex digital ecosystems.
Global Internet Intelligence and Distributed Visibility Model
A major strength of the ThousandEyes Endpoint Agent lies in how it contributes to a broader internet intelligence system rather than operating as an isolated monitoring tool. In modern digital ecosystems, visibility cannot stop at the boundary of an organization’s internal network. Applications depend on a complex chain of external systems, including cloud providers, content delivery networks, DNS services, and global backbone infrastructure.
The Endpoint Agent, developed by ThousandEyes, participates in a distributed visibility model that aggregates performance signals from endpoints across the world. Each agent acts as a measurement node, continuously observing how internet paths behave under real-world conditions.
This distributed model allows organizations to understand not only what is happening inside their own infrastructure, but also how the broader internet ecosystem is performing at any given moment. Instead of treating the internet as a single uniform network, it reveals it as a dynamic system of interconnected domains, each with its own behavior patterns and potential failure points.
For example, a slowdown in application performance might not be caused by internal servers at all. It could be the result of congestion in a transcontinental routing path or instability within a regional ISP. The Endpoint Agent helps uncover these hidden dependencies by mapping traffic flows across multiple independent networks.
This global perspective is particularly valuable for organizations operating across multiple regions. A service that performs well in one part of the world may behave differently elsewhere due to variations in routing efficiency, peering agreements, or infrastructure quality. By collecting data from diverse geographic endpoints, the system builds a living model of internet health.
Adaptive Measurement Techniques for Dynamic Network Conditions
Network conditions are not static. They fluctuate based on time of day, user density, infrastructure load, and external disruptions. The Endpoint Agent is designed to adapt to these changing conditions by dynamically adjusting its measurement strategies.
Rather than relying on fixed monitoring intervals alone, the agent can trigger additional measurements when anomalies are detected. For example, if latency suddenly increases during a user session, the agent may initiate deeper diagnostic tests to determine whether the issue is persistent or temporary.
This adaptive behavior ensures that critical events are captured in greater detail while avoiding unnecessary overhead during stable conditions. It creates a balance between continuous monitoring and efficient resource usage.
Another important aspect of adaptive measurement is contextual awareness. The agent considers the type of application being used and adjusts its observation focus accordingly. Real-time applications such as voice or video communication require more sensitive monitoring of jitter and latency, while file transfers may prioritize throughput and packet integrity.
This context-driven approach ensures that the most relevant performance indicators are always prioritized. It prevents information overload and helps IT teams focus on meaningful signals rather than raw data volume.
Over time, this adaptive system becomes more refined as it learns typical behavior patterns within specific environments. While it does not function as a traditional machine learning system in every aspect, it still builds intelligence through repeated observation and pattern recognition.
Diagnosing Multi-Layer Network Failures
One of the most challenging aspects of modern networking is the layered nature of system dependencies. A single user request may pass through multiple layers, including local device processing, wireless connectivity, ISP routing, cloud gateways, application servers, and third-party services.
The Endpoint Agent is designed to break down these layers and analyze performance at each stage. This multi-layer diagnostic capability is essential for identifying where failures originate.
At the lowest level, issues may arise from local device conditions such as unstable Wi-Fi signals or overloaded hardware resources. At higher levels, problems may occur within corporate networks due to misconfigured routing or bandwidth limitations.
Beyond organizational boundaries, the agent can detect failures in external infrastructure. These might include DNS resolution delays, regional internet congestion, or outages in cloud service regions.
What makes this layered approach powerful is its ability to separate symptoms from causes. For instance, a slow-loading application might appear to be a server issue at first glance. However, endpoint analysis might reveal that the real cause is packet loss occurring several hops away in an external network.
This level of clarity reduces troubleshooting complexity significantly. Instead of investigating multiple systems blindly, IT teams can focus directly on the layer where the issue originates.
Enhancing Hybrid Workforce Connectivity
The rise of hybrid and remote work has dramatically changed how organizations think about network performance. Employees now connect from a wide variety of locations, including home networks, public internet connections, and mobile hotspots.
This diversity introduces new challenges in maintaining consistent application performance. Unlike controlled office environments, remote connections are influenced by factors beyond organizational control.
The Endpoint Agent plays a critical role in maintaining visibility across these diverse environments. By running directly on user devices, it captures performance data regardless of where the user is located.
This allows organizations to compare performance across different working conditions. For example, it can reveal whether users working from home experience higher latency than those in office environments, and if so, whether the cause lies in local networks or external routing paths.
It also helps identify inconsistent experiences among users accessing the same application. Some users may encounter delays while others experience smooth performance, even when using identical systems. The agent helps explain these differences by analyzing each network path.
This level of insight is essential for supporting hybrid work models, where performance consistency is a key factor in productivity and user satisfaction.
Application Dependency Mapping and Service Relationships
Modern applications rarely operate independently. They depend on a network of interconnected services, including authentication systems, databases, APIs, third-party integrations, and cloud services.
The Endpoint Agent contributes to understanding these dependencies by observing how applications behave when interacting with external services. When performance issues occur, it can help identify whether a dependency is causing delays.
For example, a cloud-based productivity application might rely on a third-party authentication service. If that service becomes slow or unresponsive, the entire application experience may degrade even if the core system is functioning normally.
By tracking these interactions, the agent helps build a map of service dependencies. This map reveals how different systems influence one another and where bottlenecks are likely to occur.
Understanding dependency relationships is crucial for modern digital architecture. As systems become more modular and distributed, identifying hidden relationships between services becomes increasingly complex.
The Endpoint Agent simplifies this by continuously observing how applications interact with external systems in real time. It transforms abstract dependencies into measurable performance relationships.
Long-Term Performance Trends and Behavioral Baselines
Beyond real-time monitoring, the Endpoint Agent also contributes to long-term performance analysis. Collecting continuous data over extended periods, it helps establish behavioral baselines for network and application performance.
These baselines represent normal operating conditions under typical usage scenarios. Once established, they provide a reference point for detecting anomalies.
For instance, if an application typically loads within two seconds but begins to consistently take five seconds, the deviation becomes immediately visible against the established baseline.
This approach is particularly useful for identifying gradual performance degradation. Some issues do not appear suddenly but instead develop slowly over time, making them difficult to detect without historical comparison.
Long-term data also helps organizations understand seasonal or cyclical patterns in network usage. For example, increased traffic during business hours or specific days of the week may affect performance in predictable ways.
By analyzing these trends, IT teams can make informed decisions about capacity planning, infrastructure upgrades, and resource allocation.
External Network Dependencies and Third-Party Risk Visibility
Modern digital systems depend heavily on third-party services. These include cloud hosting providers, API gateways, DNS services, and content delivery networks. While these services improve scalability and flexibility, they also introduce external dependencies that are outside direct organizational control.
The Endpoint Agent helps organizations gain visibility into these dependencies by tracking how external systems affect application performance.
If a third-party service experiences delays or outages, the agent can detect the impact on end-user experience. This allows organizations to distinguish between internal system issues and external service disruptions.
This distinction is particularly important when multiple services are involved in a single application workflow. A failure in one external component can cascade across multiple systems, creating widespread performance degradation.
By identifying these relationships, the agent supports better risk management strategies. Organizations can assess which external dependencies are most critical and prioritize resilience efforts accordingly.
It also helps improve communication with service providers by providing detailed evidence of performance issues. Instead of relying on assumptions, organizations can present precise data showing how external systems are affecting user experience.
Optimizing Digital Experience Across Geographic Regions
Geographic variation is one of the most significant factors influencing network performance. Users in different regions often experience different levels of latency, connectivity stability, and application responsiveness.
The Endpoint Agent provides detailed insight into these geographic differences by collecting data from endpoints located in multiple regions.
This allows organizations to compare performance across global user bases. For example, an application may perform well in North America but experience delays in parts of Asia or South America due to routing inefficiencies or infrastructure limitations.
By analyzing these patterns, organizations can optimize content delivery strategies, adjust server placement, or work with network providers to improve routing efficiency.
Geographic performance analysis also helps identify underserved regions where infrastructure improvements may be needed. This is particularly important for global applications that rely on consistent performance across all user locations.
Understanding regional variation ensures that digital services remain reliable and responsive regardless of where users are located.
Continuous Evolution of Endpoint Intelligence Systems
The role of endpoint-based monitoring continues to evolve as digital ecosystems become more complex. The Endpoint Agent represents a shift toward continuous intelligence systems that operate in real time across distributed environments.
Instead of relying on static reports or periodic diagnostics, organizations now have access to ongoing streams of performance data that reflect actual user experience.
This continuous flow of information enables more proactive decision-making. Issues can be identified and addressed before they escalate into widespread disruptions.
It also supports more agile infrastructure management. As network conditions change, organizations can adjust configurations dynamically rather than relying on fixed assumptions about performance.
Over time, this continuous intelligence approach leads to more resilient digital systems. Networks become better adapted to variability, and applications become more responsive to real-world conditions.
The Endpoint Agent plays a central role in enabling this transformation by serving as the primary observation point at the edge of the network.
Role of Endpoint Telemetry in Modern Cloud-Native Applications
Cloud-native applications are built using distributed components that run across multiple environments, often spanning several cloud providers and microservices architectures. In such systems, performance is no longer determined by a single server or location but by the interaction between many independent services.
The Endpoint Agent contributes to this ecosystem by providing endpoint telemetry that reflects how these complex applications behave from the user’s perspective. Instead of focusing on isolated infrastructure components, it observes the full journey of a user request as it interacts with multiple backend services.
This is particularly important in microservices-based systems, where a single user action can trigger dozens of internal API calls. A delay in any one of these calls can affect the overall user experience. The agent helps identify where in this chain performance degradation occurs.
By capturing timing data across service interactions, it becomes possible to detect inefficiencies that are not visible at the infrastructure level. For example, an individual microservice may appear healthy in isolation but still introduce delays when integrated into a larger workflow.
This level of insight allows engineering teams to optimize service interactions more effectively. Instead of focusing only on server uptime or CPU usage, they can evaluate how quickly services respond within real application flows.
Improving Incident Response Through Contextual Performance Data
Incident response in modern IT environments depends heavily on the quality of available diagnostic data. Without accurate context, teams often spend significant time identifying the root cause of an issue before they can begin resolution.
The Endpoint Agent improves this process by providing contextual performance data that reflects both network conditions and user activity at the moment an issue occurs.
When a performance degradation is detected, the agent captures surrounding conditions such as network path changes, latency spikes, and application response times. This contextual snapshot helps reconstruct the sequence of events leading to the incident.
Instead of analyzing isolated alerts, IT teams receive a coherent view of how the issue developed. This significantly reduces the time required for root cause analysis.
It also helps prevent repeated incidents. Once the underlying cause is identified, corrective actions can be applied more precisely, reducing the likelihood of recurrence.
In environments where multiple teams are involved, such as network operations, cloud engineering, and application development, this shared contextual data improves collaboration. Each team can focus on the relevant portion of the problem without needing to reconstruct the entire scenario independently.
Enhancing API Performance Visibility Across Distributed Systems
APIs are the backbone of modern digital ecosystems, enabling communication between applications, services, and external platforms. However, API performance issues can be difficult to diagnose because they often involve multiple interconnected systems.
The Endpoint Agent enhances visibility into API behavior by measuring how long requests take to complete from the user’s device. This includes tracking response times, failure rates, and variability in performance.
When an API call is slow, the agent helps determine whether the delay is caused by network conditions, backend processing, or external service dependencies. This distinction is critical for resolving performance issues efficiently.
In distributed systems, APIs may be routed through gateways, load balancers, and security layers before reaching their final destination. Each of these components can introduce delays or variability.
By observing API performance at the endpoint level, organizations gain a clearer understanding of how these layers impact user experience. It becomes possible to identify bottlenecks that would otherwise remain hidden within internal infrastructure.
This insight is especially valuable for businesses that rely heavily on real-time data exchange, such as financial services, e-commerce platforms, and collaborative software systems.
Detecting Performance Drift in Long-Running Applications
Over time, applications may gradually experience performance degradation without any obvious failure point. This phenomenon is often referred to as performance drift. It can be caused by software updates, infrastructure changes, or evolving user behavior.
The Endpoint Agent helps detect performance drift by continuously comparing current performance data against historical baselines. When small deviations begin to accumulate, they become visible through trend analysis.
For example, an application that initially loads quickly may begin to take longer due to increasing backend complexity or inefficient database queries. These changes might not trigger immediate alerts but still impact user experience over time.
By identifying these gradual shifts, organizations can take corrective action before performance becomes noticeably degraded. This proactive approach reduces the risk of user dissatisfaction and productivity loss.
Performance drift detection also helps maintain service quality standards. Instead of reacting only to major incidents, IT teams can continuously refine system performance based on long-term trends.
Strengthening Observability in Multi-Tenant Environments
Multi-tenant systems are widely used in cloud applications where multiple customers share the same underlying infrastructure. While this model improves scalability and efficiency, it also introduces challenges in maintaining consistent performance across tenants.
The Endpoint Agent contributes to observability in these environments by capturing performance data across different user groups. This allows organizations to identify whether specific tenants are experiencing degraded performance compared to others.
If one group of users consistently experiences slower response times, the agent can help determine whether the issue is related to network routing, resource allocation, or service configuration.
This level of visibility is essential for maintaining fairness and reliability in shared environments. It ensures that no single tenant is disproportionately affected by performance issues.
It also supports capacity planning by revealing how different usage patterns impact system performance. Organizations can use this information to optimize resource distribution and improve overall system stability
Conclusion
The ThousandEyes Endpoint Agent represents a major shift in how organizations understand and manage network performance in today’s highly distributed digital environment. Instead of relying solely on traditional infrastructure monitoring, it focuses on real user experience, capturing performance data directly from endpoints where users interact with applications.
Analyzing key metrics such as latency, packet loss, jitter, and application responsiveness, it provides a clearer picture of how networks behave in real-world conditions. Its ability to trace network paths, observe external dependencies, and detect issues across multiple layers makes it especially valuable in complex cloud and hybrid infrastructures.
Beyond troubleshooting, the Endpoint Agent supports long-term performance optimization by identifying trends, uncovering hidden bottlenecks, and improving visibility into third-party services. It also enhances collaboration between IT teams by providing shared, context-rich insights during incident resolution.
As digital ecosystems continue to expand, the need for end-user-centric monitoring will only grow. The Endpoint Agent helps bridge the gap between infrastructure performance and user experience, ensuring that organizations can maintain reliable, high-quality digital services across global networks and evolving application landscapes.