The netstat command is a built-in networking utility used in operating systems to display detailed information about network connections, routing tables, listening ports, and interface statistics. The name comes from “network statistics,” which reflects its main purpose of providing a real-time snapshot of what is happening inside the network layer of a system. It is widely used by administrators and technical users because it helps reveal how a device is communicating with other systems, both locally and over a network. By running this command, you can quickly observe active connections, identify open ports, and understand how data is flowing between devices.
Unlike many advanced monitoring tools that require installation or configuration, netstat is typically already available in most operating systems. This makes it especially useful in troubleshooting situations where quick diagnostics are needed. Whether you are investigating slow performance, checking for unauthorized connections, or verifying whether a service is running correctly, netstat provides immediate visibility into network behavior without requiring complex setup or external software.
Purpose of the netstat Command in Network Monitoring
The primary purpose of netstat is to give users insight into the current state of network activity on a system. Computers constantly communicate with other devices through ports and protocols, but these processes often happen silently in the background. Netstat brings this hidden activity into view by listing every active connection and showing how they are interacting at a given moment.
This visibility is essential for diagnosing network issues. For example, if a website or application is not responding, netstat can help determine whether the system is actually listening on the expected port. It can also reveal whether connections are being established successfully or failing due to configuration issues. In this way, netstat acts as a first-line diagnostic tool that helps narrow down the source of network-related problems before more advanced troubleshooting tools are used.
How netstat Collects and Displays Information
Netstat works by retrieving data directly from the operating system’s networking subsystem. The operating system maintains internal tables that track every active connection, open port, and routing decision. These tables are constantly updated as applications send and receive data across the network. Netstat accesses this information and organizes it into a readable format for the user.
When executed, the command takes a snapshot of these internal records at that exact moment. This means that the output reflects real-time network activity rather than historical data. Each time the command is run, the results may look slightly different depending on what connections are active. This real-time nature makes netstat especially useful for monitoring dynamic network environments where conditions change rapidly.
Role of Active Connections in netstat Output
One of the most important features of netstat is its ability to display active connections. Every time a device communicates with another system, a connection is established between a local port and a remote address. Netstat lists these connections along with their current status, allowing users to see exactly which systems are communicating.
These connections may be in different states depending on their activity. Some may be actively transferring data, while others may be waiting for responses or closing down. By analyzing these states, users can understand whether network communication is functioning normally or if there are interruptions. This is particularly helpful in environments where multiple services are running simultaneously and network traffic must be carefully managed.
Understanding Listening Ports in netstat
Another critical function of netstat is showing listening ports. A listening port is a network endpoint that is waiting for incoming connections. Services such as web servers, file servers, and database systems rely on listening ports to accept requests from other devices.
Netstat displays these ports so users can verify whether services are properly running and ready to accept connections. If a service is expected to be active but its port is not listed as listening, it often indicates a configuration issue or service failure. This makes netstat an important tool for ensuring that network services are correctly deployed and accessible.
Routing Information and Its Importance
Netstat also provides access to routing information, which determines how data is directed across networks. Every system maintains a routing table that guides network traffic toward its destination. This table includes rules that define which paths data should follow depending on IP addresses and network interfaces.
By displaying this routing information, netstat allows users to verify whether data is being sent through the correct network paths. If routing entries are incorrect, communication problems can occur, such as inability to reach external networks or misdirected traffic. Understanding routing behavior is essential for diagnosing connectivity issues in both small and large network environments.
Interface Statistics and Network Performance Insight
In addition to connections and routing data, netstat can also provide statistics about network interfaces. These statistics include information such as the number of packets sent and received, errors encountered during transmission, and data loss occurrences. This information helps users evaluate the performance and reliability of network interfaces.
When network performance issues arise, such as slow speeds or intermittent connectivity, interface statistics can help identify whether the problem is caused by hardware limitations, network congestion, or configuration errors. High error rates or dropped packets may indicate underlying issues that require further investigation. By analyzing these statistics, users gain a clearer understanding of how efficiently their network interfaces are operating.
Structure of netstat Output and Its Components
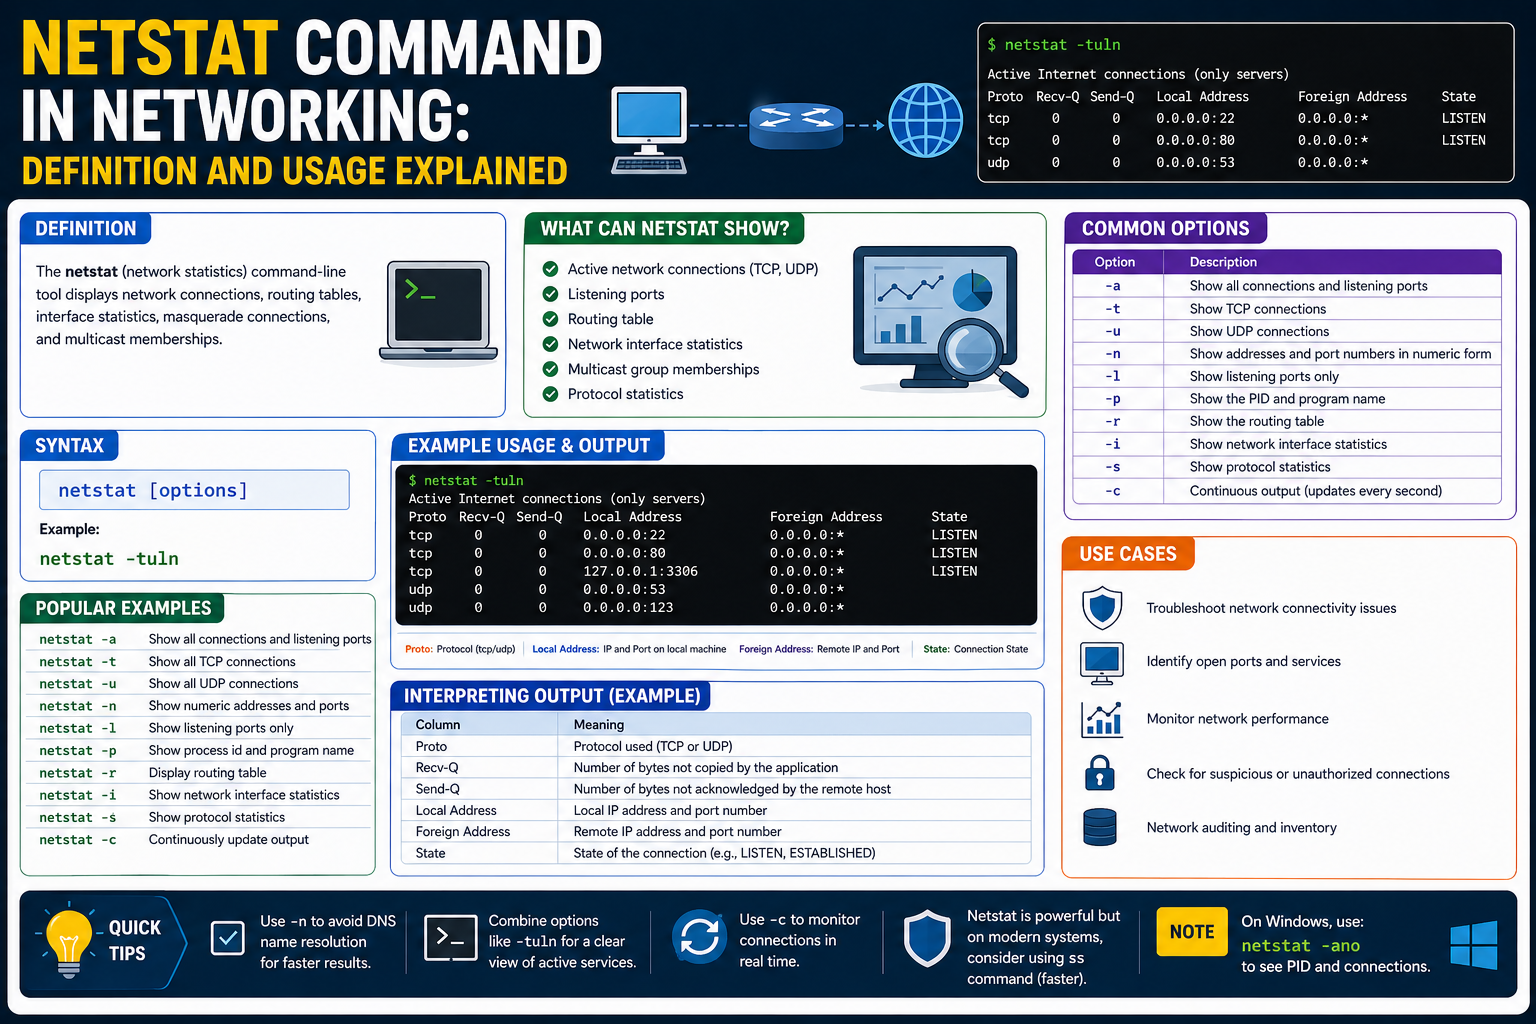
The output of netstat is organized into several key columns that describe different aspects of each network connection. One of the main components is the protocol type, which indicates whether the connection uses TCP or UDP. TCP is connection-oriented and ensures reliable data delivery, while UDP is connectionless and prioritizes speed over reliability.
Another important component is the local address, which shows the system’s own IP address and port number. This identifies the source of the connection. Alongside it is the foreign address, which represents the remote system involved in the communication. Finally, the state column provides information about the status of the connection, such as whether it is established, listening, or in the process of closing.
Significance of Connection States in Network Analysis
Connection states are an essential part of interpreting netstat output. Each state represents a specific phase in the lifecycle of a network connection. For instance, an established state indicates that communication between two systems is active and ongoing. A listening state shows that a service is waiting for incoming requests.
Other states, such as time waiting or close waiting, represent transitional phases where connections are being terminated or cleaned up. Understanding these states helps users determine whether network behavior is normal or if there are issues with how connections are being managed. Proper interpretation of these states is crucial for effective network troubleshooting.
Real-Time Network Visibility Provided by netstat
One of the most valuable aspects of netstat is its ability to provide real-time visibility into network activity. Unlike logs or historical reports, netstat shows exactly what is happening at the moment the command is executed. This makes it especially useful for identifying immediate problems or verifying system behavior during active troubleshooting.
Because network conditions can change quickly, having a tool that provides instant snapshots is extremely useful. Administrators can run the command multiple times to observe changes in connection behavior, identify unusual patterns, or confirm whether changes in configuration have taken effect. This real-time insight is one of the reasons netstat remains widely used despite the emergence of newer tools.
Importance of netstat in Everyday Network Troubleshooting
Netstat plays a central role in everyday network troubleshooting tasks. It is often the first tool used when diagnosing connectivity problems because it provides quick and reliable information about system-level network activity. Whether the issue involves a service not responding, unexpected traffic, or suspected unauthorized access, netstat helps narrow down the cause.
By examining active connections, listening ports, and routing information, users can quickly identify whether a problem is local or external. This reduces the time needed to isolate issues and allows for more efficient problem-solving. Even in complex environments, netstat remains a foundational tool that supports early-stage diagnosis and network analysis.
Understanding netstat in Network Troubleshooting Environments
Netstat is widely used in troubleshooting because it provides direct visibility into what a system is doing on the network at any given moment. When a network issue occurs, such as a service not responding, a website failing to load, or a remote connection timing out, the first step in many diagnostic processes is to check whether the system is actually communicating over the network as expected. Netstat helps answer this immediately by showing active connections, open ports, and current connection states.
In practical troubleshooting, netstat helps separate application-level problems from network-level problems. For instance, if a web service is not accessible, netstat can confirm whether the service is listening on the correct port. If the port is not listed, the issue may lie in the service configuration or whether the service is running at all. If the port is listening but connections are not being established, the issue may be related to firewall rules or external network restrictions. This ability to narrow down the problem area makes netstat a key diagnostic tool in early-stage troubleshooting.
Role of netstat in Identifying Network Services
Every network service running on a system must bind to a port in order to accept incoming connections. Netstat provides a clear view of which services are actively listening on these ports. This is important because multiple services may run on the same system, and each must be assigned a unique port or configured properly to avoid conflicts.
By checking listening ports, users can verify whether expected services are running correctly. For example, a web server typically listens on standard ports for web traffic, and a database server listens on its own designated port. If netstat does not show a service in the listening state, it may indicate that the service has failed to start, crashed, or is misconfigured. This immediate visibility helps administrators ensure that essential services are available and functioning as intended.
Monitoring Connection Flow and Communication Patterns
Netstat also plays an important role in understanding how data flows between systems. Each active connection represents a communication channel between a local system and a remote system. These connections are not static; they continuously change as data is transmitted, sessions are established, and connections are closed.
By observing these connection patterns, it becomes possible to understand how applications interact over the network. For example, a browser may open multiple connections to different servers to load web content, while a messaging application may maintain persistent connections to ensure real-time communication. Netstat allows users to see these behaviors clearly and understand how different applications use network resources.
This visibility is especially useful in environments where multiple applications compete for network bandwidth. By analyzing connection patterns, administrators can identify which applications are generating the most traffic and whether any unexpected communication is taking place.
Detecting Abnormal or Suspicious Network Activity
One of the important uses of netstat is identifying unusual or potentially suspicious network behavior. Since it displays all active connections, it can reveal unexpected communication between a system and unknown external addresses. This is particularly important in security monitoring, where unauthorized connections may indicate malware, compromised systems, or unauthorized access attempts.
By regularly reviewing netstat output, users can establish a baseline of normal network behavior. Once this baseline is understood, any deviation becomes easier to detect. For example, if a system that normally communicates with a limited set of servers suddenly begins connecting to unknown external IP addresses, this may signal a security concern. Similarly, unexpected open ports may indicate that a service has been installed or activated without authorization.
This ability to expose hidden or unusual activity makes netstat a valuable tool in basic security monitoring, especially in environments where more advanced monitoring systems are not available.
Understanding TCP and UDP Behavior in netstat Output
Netstat displays information about both TCP and UDP connections, and understanding the difference between these protocols is important for interpreting the output correctly. TCP connections are connection-oriented, meaning they establish a reliable session between two systems before data is exchanged. This ensures that data is delivered in the correct order and that missing packets are retransmitted if necessary.
UDP, on the other hand, is connectionless and does not guarantee delivery or order. It is used in situations where speed is more important than reliability, such as streaming or real-time communication. Because of these differences, TCP connections often appear with detailed states, while UDP entries typically show simpler information.
Understanding which protocol is being used helps users interpret whether a connection is behaving normally. For example, multiple TCP connections in an established state indicate ongoing communication, while UDP entries may simply reflect active data transmission without visible connection states.
Analyzing Local and Remote Address Information
Netstat output includes both local and foreign address fields, which are essential for understanding network communication endpoints. The local address represents the system’s own IP address and port number used in a connection. This identifies which application or service is participating in the communication on the local machine.
The foreign address represents the remote system involved in the connection. This could be a server, another computer on the local network, or a device located anywhere on the internet. By examining both addresses together, users can clearly see where data is coming from and where it is going.
This information is particularly useful when diagnosing connectivity issues or tracking communication paths. If a system is connecting to an unexpected remote address, it may require further investigation to determine whether the connection is legitimate or potentially harmful.
Importance of Connection States in Network Behavior Analysis
Each network connection shown in netstat has a state that describes its current condition. These states help users understand what stage a connection is in and whether it is functioning normally. For example, an established state indicates that communication between two systems is active and stable.
Other states represent transitional phases. A listening state indicates readiness to accept incoming connections, while a time waiting state indicates that a connection is in the process of closing. These states may seem complex at first, but they provide valuable insight into how connections are managed at the system level.
By observing these states, users can identify potential issues such as connections that are not closing properly or services that are not accepting incoming requests. This makes connection state analysis an important part of network diagnostics.
Using netstat for System Performance Observation
Beyond connectivity analysis, netstat also helps in understanding overall system performance from a network perspective. High numbers of active connections may indicate heavy system usage, while large amounts of data transfer can show bandwidth consumption patterns. Interface statistics provide additional insight into how efficiently a system is handling network traffic.
If a system is experiencing slow performance, netstat can help determine whether the issue is related to network congestion or application behavior. For example, a sudden increase in connections or data transmission may indicate that an application is consuming excessive network resources. Similarly, high error counts or dropped packets may point to hardware or configuration issues affecting performance.
By combining connection data with interface statistics, users gain a more complete understanding of system performance and network efficiency.
Limitations in Modern Network Environments
While netstat is powerful, it does have limitations, especially in modern computing environments. In virtualized and containerized systems, network activity may be distributed across multiple layers, making it harder to interpret netstat output accurately. Each container or virtual machine may maintain its own network namespace, meaning netstat may only show a portion of the overall network activity depending on where it is executed.
In cloud-based environments, networking is often managed through abstracted systems that may not be fully visible through traditional netstat output. This can make troubleshooting more complex and require additional tools that are designed for modern infrastructure. Despite these limitations, netstat still provides valuable insights at the system level and remains useful for quick diagnostics and basic network observation.
Interpreting netstat Data in Practical Scenarios
In real-world usage, interpreting netstat data requires understanding context. A large number of connections may be normal for a busy server but unusual for a personal computer. Similarly, multiple listening ports may be expected on a server hosting several services but could indicate unexpected software on a workstation.
Effective interpretation involves combining knowledge of system behavior with netstat output. Over time, users become familiar with what normal output looks like for their systems, making it easier to identify irregular patterns. This experience-based understanding is one of the most valuable aspects of using netstat in practice.
Advanced Interpretation of netstat Output in Real Systems
Netstat becomes more powerful when its output is not just observed but interpreted in context. In real systems, raw connection data alone does not tell the full story. The meaning emerges when you understand how applications, services, and operating system behavior interact with network activity. Each line of netstat output represents a small piece of a larger communication process happening inside the system.
In a typical environment, dozens or even hundreds of connections may appear at once. These connections can belong to system services, background updates, user applications, or external communication processes. Without interpretation, this can look overwhelming, but with understanding, it becomes a structured view of system behavior. Recognizing patterns in these connections helps identify what is normal activity and what might require further attention.
Understanding High Connection Volumes and System Behavior
A high number of network connections shown in netstat output does not automatically indicate a problem. In many cases, it simply reflects a system that is actively performing its tasks. For example, modern applications often open multiple connections simultaneously to improve performance, load balance requests, or maintain persistent communication with servers.
However, when connection counts suddenly increase beyond expected levels, it may indicate unusual behavior. This could be caused by a misconfigured application, excessive background processes, or even unwanted software activity. Observing connection volume over time helps establish a baseline, making it easier to detect deviations from normal system behavior.
By consistently analyzing connection patterns, users can distinguish between expected system activity and potential anomalies that may require further investigation.
Role of Persistent Connections in Network Activity
Some network connections are designed to remain open for long periods of time. These are known as persistent connections and are commonly used in applications that require continuous communication. Examples include messaging services, streaming platforms, and remote management tools.
Netstat displays these persistent connections in an established state, showing that communication between systems is ongoing. These connections help reduce overhead by avoiding the need to repeatedly establish and close sessions. Instead, data flows continuously through a stable channel.
Understanding persistent connections is important because they can sometimes be mistaken for unusual activity. However, in many modern applications, they are completely normal and necessary for efficient operation.
Identifying Network Resource Consumption Through netstat
Netstat can also provide indirect insight into how network resources are being consumed across a system. While it does not measure bandwidth usage directly in a detailed way, it does show connection counts, interface statistics, and data flow indicators that help estimate network load.
When many applications are active simultaneously, network resources are shared among them. Netstat can help identify which processes are generating the most connections or maintaining the largest number of active sessions. This information is useful when diagnosing slow network performance or identifying applications that may be using more resources than expected.
By analyzing these patterns, users can make informed decisions about optimizing system performance or adjusting network configurations.
Understanding TIME_WAIT and Connection Lifecycle Behavior
One of the most commonly misunderstood states in netstat output is TIME_WAIT. This state appears after a connection has been closed but is still being maintained temporarily by the system. It is part of the normal TCP lifecycle and ensures that delayed packets from the previous connection do not interfere with new connections.
Seeing multiple TIME_WAIT entries is not necessarily a problem. In fact, it is a normal behavior in systems that handle a large number of short-lived connections. However, extremely high numbers of TIME_WAIT states may indicate that an application is frequently opening and closing connections instead of reusing them efficiently.
Understanding connection lifecycle behavior helps prevent misinterpretation of netstat data and allows users to focus on actual issues rather than normal protocol behavior.
Recognizing CLOSE_WAIT and Potential Application Issues
Another important connection state is CLOSE_WAIT. This state indicates that the remote side of a connection has closed the session, but the local application has not yet completed its own cleanup process. While occasional CLOSE_WAIT entries are normal, a large number of them may indicate that an application is not properly handling connection closures.
This situation can lead to resource leaks over time, where system resources are gradually consumed by incomplete connections. If left unresolved, it may eventually affect system performance or stability. Monitoring CLOSE_WAIT states can therefore help identify poorly behaving applications or coding issues within networked software.
Filtering and Refining netstat Output for Clarity
On busy systems, netstat output can become extensive and difficult to analyze manually. To make the information more useful, filtering techniques are often applied to narrow down results. This allows users to focus on specific types of connections, ports, or protocols instead of viewing everything at once.
Filtering helps reduce information overload and makes troubleshooting more efficient. For example, focusing only on listening ports can help quickly determine which services are active on a system. Similarly, isolating established connections can provide insight into active communication channels without distraction from background noise.
This refinement process is essential when working in complex environments where multiple services are running simultaneously.
Importance of IP Address Interpretation in netstat Analysis
IP addresses shown in netstat output provide critical context for understanding network communication. Each connection involves a local IP address and a remote IP address, both of which help identify the endpoints of communication.
Local addresses indicate where services are running on the system, while remote addresses show external systems involved in communication. By analyzing these addresses, users can determine whether connections are internal, external, expected, or potentially suspicious.
In environments with multiple network interfaces, IP address interpretation becomes even more important. Systems may have several active network paths, and netstat helps clarify which interface is being used for each connection.
Network State Transitions and System Responsiveness
Network connections do not remain static; they continuously transition between different states as communication progresses. These transitions reflect the lifecycle of data exchange between systems. Netstat captures these transitions at a specific moment, offering a snapshot of ongoing changes.
Understanding these transitions helps users evaluate system responsiveness. For example, connections that remain stuck in intermediate states for too long may indicate delays or communication issues. On the other hand, smooth transitions between states suggest healthy network behavior.
By observing these patterns over time, users can gain deeper insight into how efficiently a system handles network communication.
Impact of Background Services on netstat Output
Many systems run background services that continuously generate network activity. These services may include update mechanisms, synchronization tools, monitoring agents, or system-level communication processes. As a result, netstat output often includes connections that are not directly visible to the user through active applications.
Understanding the role of background services is important because they can significantly influence network behavior. Without this knowledge, it may be difficult to distinguish between user-driven activity and system-driven activity.
By recognizing these hidden contributors, users can better interpret netstat data and avoid misattributing normal system behavior to potential issues.
Evaluating Network Stability Through Repeated Observations
Netstat becomes more powerful when used repeatedly over time rather than as a single snapshot. Network conditions are dynamic, and a single observation may not fully represent system behavior. By running netstat at different intervals, users can observe patterns, changes, and trends in network activity.
This repeated observation helps identify whether issues are temporary or persistent. For example, intermittent spikes in connections may indicate occasional network stress, while consistent abnormal behavior may suggest a deeper underlying problem.
Over time, this approach builds a more complete picture of network stability and system reliability, making netstat a valuable tool for ongoing monitoring and analysis.
Common Misinterpretations of netstat Output
Netstat is often simple to run but easy to misread if the output is not properly understood. One of the most common mistakes is assuming that every connection shown is active in a meaningful way. In reality, many entries represent background system activity, temporary states, or routine protocol behavior that is completely normal.
For example, seeing multiple connections in transitional states may look alarming at first, but these are often part of standard connection cleanup processes. Similarly, repeated local connections may simply represent internal communication between services running on the same machine. Without proper interpretation, these normal behaviors can be mistaken for issues.
Another frequent misunderstanding is interpreting all foreign addresses as external threats. While some may represent internet-based communication, many are legitimate services such as update servers, cloud platforms, or internal network devices. Context is essential when analyzing these addresses.
Distinguishing Normal Activity from Abnormal Patterns
To effectively use netstat, it is important to distinguish between normal system behavior and truly abnormal patterns. Normal activity typically includes connections to known services, expected ports, and predictable communication flows between applications and external servers.
Abnormal activity, on the other hand, may involve unexpected remote addresses, unusual port usage, or persistent unknown connections. These patterns require further investigation to determine whether they are caused by misconfiguration, software errors, or potential security concerns.
Establishing what “normal” looks like for a specific system is essential. Once this baseline is understood, deviations become easier to identify and analyze. This makes netstat not just a diagnostic tool, but also a baseline monitoring instrument for system behavior.
Limitations in Visibility of Process-Level Information
While netstat shows network connections, it does not always provide full visibility into the processes responsible for them. In some operating systems or configurations, it may show limited or no direct mapping between connections and running applications.
This limitation can make it harder to identify exactly which program is responsible for a specific connection. As a result, additional tools are often required to bridge this gap. Even so, netstat still provides valuable clues through port numbers and connection patterns that can help narrow down the source.
Understanding this limitation is important because it prevents overreliance on netstat alone for complete system analysis. It is most effective when used as part of a broader diagnostic approach.
Netstat in Modern Network Architectures
Modern computing environments have become significantly more complex due to virtualization, containerization, and cloud-based infrastructure. These technologies introduce multiple layers of networking that may not be fully visible through traditional netstat output.
In virtualized systems, multiple virtual machines may share the same physical hardware while maintaining separate network stacks. Similarly, containerized environments isolate networking at the container level, meaning netstat output inside a container only reflects that container’s activity, not the entire host system.
Cloud environments add another layer of abstraction, where networking is often managed through software-defined systems. These layers can limit the visibility of traditional tools, making netstat only a partial view of the full network picture.
Despite these limitations, netstat still remains useful for inspecting local network activity and verifying system-level connections within its visible scope.
Comparing netstat with Modern Networking Tools
While netstat has been a foundational networking tool for many years, modern systems now offer additional utilities that provide more detailed or specialized insights. These newer tools are often designed to overcome some of the limitations found in traditional utilities.
For example, some modern tools provide real-time traffic analysis, deeper process-to-connection mapping, or enhanced filtering capabilities. They may also offer improved compatibility with containerized and cloud-based environments.
However, netstat remains valuable because of its simplicity, availability, and speed. It does not require advanced configuration and can be used immediately on most systems. This makes it particularly useful for quick diagnostics and initial troubleshooting before more advanced tools are applied.
Practical Scenarios Where netstat Is Most Effective
Netstat is especially effective in situations where quick answers are needed. For example, when a service is not responding, checking whether the expected port is listening can immediately confirm whether the service is active. If the port is not listed, the issue likely lies within the service itself rather than the network.
It is also useful when verifying whether a system is communicating with expected remote servers. This helps ensure that applications are functioning correctly and not encountering unexpected communication failures.
In security-related scenarios, netstat can help identify unexpected connections or unusual network behavior. Even though it is not a full security tool, it provides early indicators that something may require deeper investigation.
Understanding netstat as a Baseline Diagnostic Tool
One of the most important ways to view netstat is as a baseline diagnostic tool rather than a complete monitoring solution. It provides a snapshot of network activity at a specific moment, which is extremely useful for quick checks and initial analysis.
However, because it does not store historical data or provide advanced analytics, it is not intended for long-term monitoring on its own. Instead, it works best when combined with other tools that provide deeper insights into performance trends and historical behavior.
By understanding its role as a baseline tool, users can apply netstat more effectively and avoid expecting it to perform tasks beyond its intended scope.
Value of netstat in Learning Network Fundamentals
Beyond troubleshooting, netstat also plays an important role in learning and understanding networking concepts. By observing real-time connections, users can see how abstract networking ideas function in practice.
Concepts such as ports, protocols, IP addressing, and connection states become easier to understand when they are visible in live system output. This makes netstat a valuable educational tool for anyone studying networking fundamentals or preparing for technical certifications.
Seeing actual network behavior reinforces theoretical knowledge and helps build practical understanding of how systems communicate over networks.
Long-Term Relevance of netstat in Networking
Even though newer tools have emerged, netstat continues to remain relevant due to its simplicity and wide availability. It is still included in many operating systems and is often one of the first tools learned by network administrators and IT professionals.
Its long-standing presence in networking environments means that it is widely understood and consistently reliable for basic diagnostics. While it may not provide the depth of modern monitoring systems, it continues to serve as a dependable starting point for analyzing network behavior.
In many cases, netstat remains the quickest way to gain immediate insight into what a system is doing on the network.
Final conclusion
Netstat serves as a foundational tool for observing and understanding network activity at the system level. It provides visibility into active connections, listening ports, routing behavior, and interface statistics, all of which are essential for diagnosing and analyzing network behavior.
While it has limitations in modern environments and does not offer advanced analytics, its strength lies in simplicity and immediate access to critical network information. It helps users quickly identify issues, verify service behavior, and gain insight into how systems communicate.
By combining netstat with broader knowledge of networking principles and complementary tools, users can build a strong understanding of network operations and improve their ability to troubleshoot and manage systems effectively.