The OSI (Open Systems Interconnection) model is a foundational framework in networking that helps explain how data moves from one device to another across a network. It breaks down complex communication processes into seven structured layers, making it easier to understand how hardware and software interact during data transmission. Learning how to read an OSI model chart is essential for anyone studying networking, IT infrastructure, or cybersecurity because it provides a clear mental map of how systems communicate step by step.
Why the OSI Model Matters in Networking
The OSI model is not just theoretical; it is widely used as a reference point in real-world networking troubleshooting and system design. It helps IT professionals identify where a problem is occurring in the communication process. Instead of guessing randomly, technicians can isolate issues to a specific layer, such as cabling issues at the physical layer or IP routing problems at the network layer. This structured approach saves time and makes troubleshooting far more efficient and logical.
Understanding the Structure of an OSI Model Chart
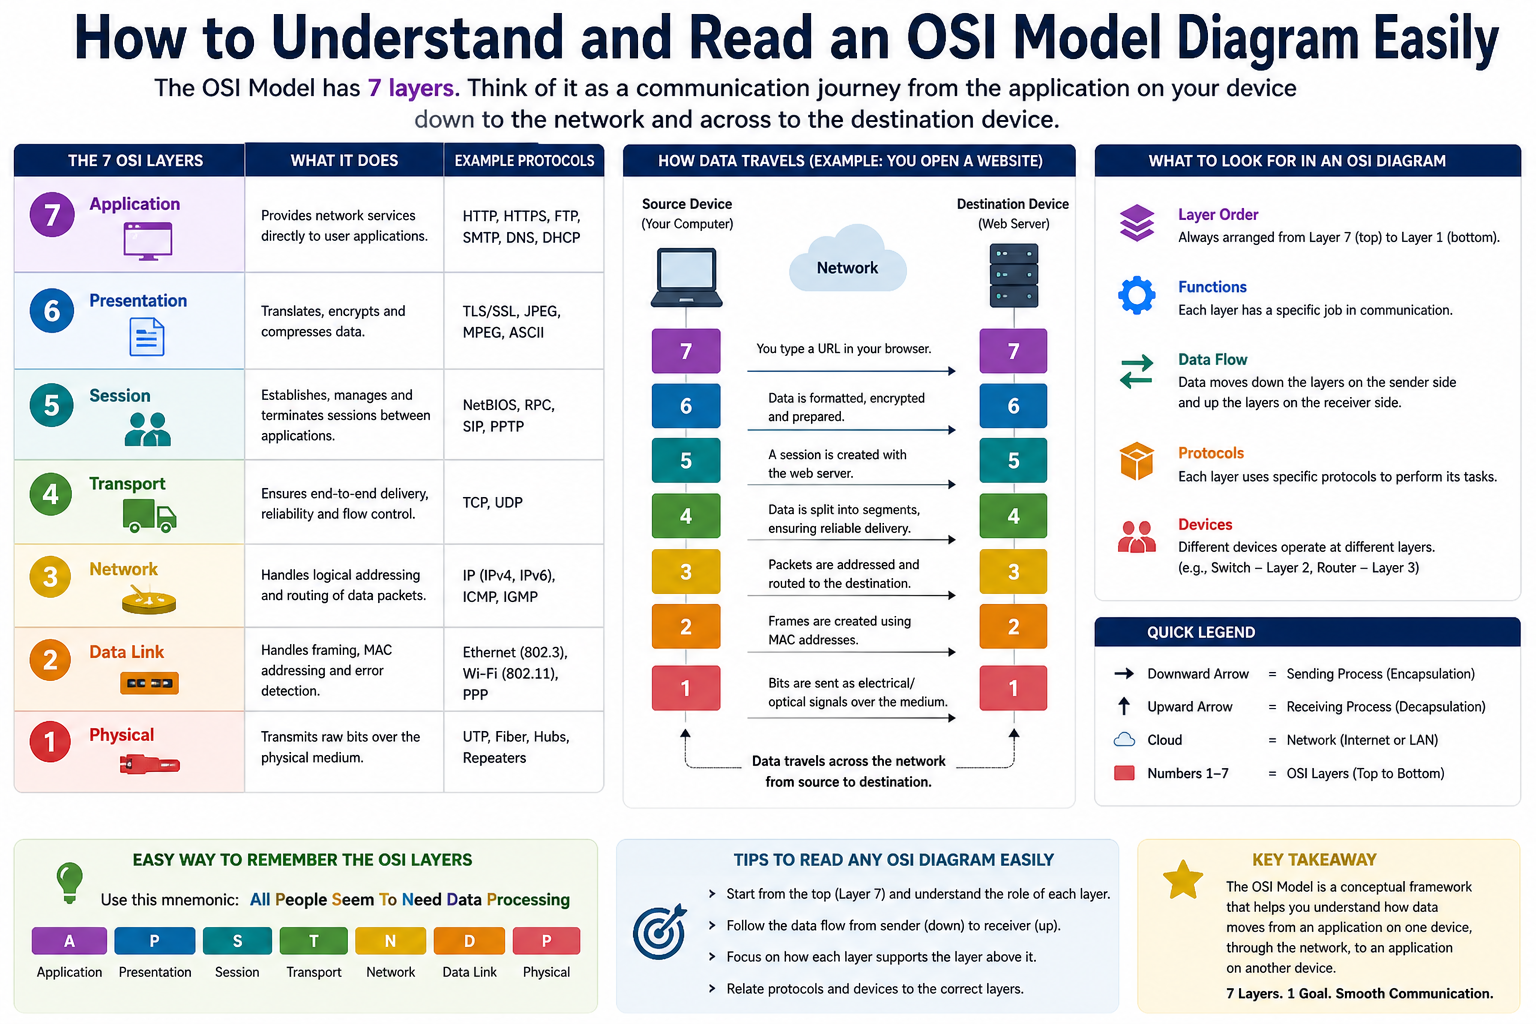
An OSI model chart typically presents seven layers arranged in a vertical or horizontal format, showing how data flows from the top layer (application) down to the bottom layer (physical) and then back up again at the receiving end. Each layer represents a specific function in the communication process. While charts may look different visually, the core concept remains the same: data moves through a layered system where each layer adds or removes information before passing it along.
Key Idea Behind Layered Communication
The OSI model works on the principle of layered abstraction. Each layer has a specific responsibility and only interacts with the layers directly above and below it. This design ensures that changes in one layer do not disrupt the entire system. For example, changes in network hardware do not affect application software directly because the layers between them manage communication. This separation simplifies design, development, and troubleshooting.
Data Flow in the OSI Model
When data is sent from one device to another, it travels downward through the OSI layers. At each layer, additional information is attached to the data in a process called encapsulation. Once the data reaches the physical layer, it is transmitted as electrical signals, light pulses, or radio waves. On the receiving end, the process is reversed through de-encapsulation, where each layer removes its corresponding information until the original data is delivered to the application.
Encapsulation and De-Encapsulation Explained Simply
Encapsulation is a critical concept when reading an OSI model chart. As data moves from the top layer to the bottom layer, each layer adds its own header (and sometimes footer) containing control information. This ensures proper delivery, routing, and error checking. De-encapsulation happens at the receiving end, where each layer strips off its added information before passing the data upward. This back-and-forth process ensures reliable communication between devices.
Reading the OSI Model from Top to Bottom
One of the easiest ways to understand an OSI model chart is to read it from top to bottom. The top layers deal with user interaction and software applications, while the bottom layers handle physical transmission of data. As you move downward, data becomes more structured and closer to actual hardware signals. This downward flow represents how raw user input is gradually converted into signals that can travel across cables or wireless connections.
Reading the OSI Model from Bottom to Top
When data reaches the receiving device, the OSI model is read from bottom to top. Physical signals are first interpreted into bits, then structured into frames, packets, and eventually usable data. This upward flow ensures that information is reconstructed properly before being presented to the user. Understanding both directions is essential for interpreting OSI charts accurately.
Understanding Layer Interdependence
Although each OSI layer operates independently, they are deeply interconnected. A failure in one layer affects the layers above it. For example, if the physical layer has a broken cable, no data can reach higher layers regardless of how well those layers are functioning. Similarly, incorrect IP configuration at the network layer can prevent communication even if the physical connection is perfect. OSI charts help visualize these dependencies clearly.
Introduction to OSI Layer Functions
Each OSI layer has a unique role in the communication process. These roles include transmitting raw signals, managing addressing, routing data, ensuring reliability, maintaining sessions, formatting data, and providing user interfaces. Understanding these roles is the first step in learning how to read an OSI model chart effectively. Instead of memorizing everything at once, it is better to understand how each layer contributes to the overall system.
Layer 1: Physical Layer Overview
The physical layer is the foundation of the OSI model. It is responsible for transmitting raw binary data—ones and zeros—over a physical medium such as copper cables, fiber optics, or wireless signals. This layer defines the electrical, mechanical, and procedural aspects of communication. It does not interpret data but only carries it in the form of signals.
What Happens at the Physical Layer
At this layer, data from higher layers is converted into electrical signals or light pulses depending on the transmission medium. These signals are then sent across the network to another device. On the receiving side, the signals are converted back into binary data. This transformation ensures that digital information can physically travel across distances.
Data Unit at the Physical Layer
The data unit at this layer is bits. These bits represent the most basic form of data in computing. Whether it is text, images, or videos, everything is ultimately broken down into binary form before transmission. The physical layer ensures that these bits are transmitted accurately and efficiently.
Devices Operating at the Physical Layer
Several hardware components operate at the physical layer, including cables, hubs, repeaters, connectors, and wireless access points. These devices are responsible for carrying signals rather than interpreting them. For example, a cable simply transmits electrical signals, while a repeater strengthens weak signals to maintain transmission quality over long distances.
Introduction to Layer 2: Data Link Layer
Above the physical layer lies the data link layer, which plays a more intelligent role in data transmission. It ensures that data is transferred between two directly connected nodes and handles error detection and correction. This layer introduces structure to raw bits by organizing them into frames.
Understanding Frames in the Data Link Layer
Frames are the data units used at this layer. A frame contains not only the actual data but also important control information such as source and destination hardware addresses. These addresses, known as MAC addresses, ensure that data reaches the correct device within a local network.
Structure of a Frame
A typical frame includes several parts. The preamble helps identify the start of the frame. The header contains MAC addresses and protocol information. The payload carries the actual data being transmitted. Finally, the frame check sequence ensures that errors are detected during transmission. This structured format helps maintain reliable communication within networks.
Functions of the Data Link Layer
The data link layer is responsible for organizing raw bits into structured frames, managing access to the network medium, and detecting transmission errors. It also controls how devices share the same communication channel to avoid data collisions. These functions make local network communication stable and efficient.
Protocols Used at the Data Link Layer
Common protocols at this layer include Ethernet, PPP, and Frame Relay. These protocols define how data is formatted, transmitted, and received over different types of networks. Ethernet is especially important in local area networks where multiple devices share the same communication medium.
Devices Operating at the Data Link Layer
Switches and network interface cards primarily operate at this layer. Switches use MAC addresses to forward data to the correct device within a local network. Unlike higher-layer devices, they do not interpret IP addresses but focus on hardware-level communication.
Difference Between Layer 1 and Layer 2
A key point in reading OSI charts is understanding the difference between the physical and data link layers. While the physical layer deals with raw signal transmission, the data link layer adds structure and ensures accurate delivery between directly connected devices. This distinction is fundamental for understanding how data begins its journey across a network.
Early Concept of Data Movement in OSI Model
At this stage of the OSI model, it becomes clear that data does not move in a simple straight line. Instead, it is transformed at each layer, gaining additional information before transmission and losing it during reception. This layered transformation is what allows complex communication systems like the internet to function smoothly.
Understanding How OSI Charts Show Layer 2 in Detail
When you look deeper into an OSI model chart, the data link layer is often shown as the bridge between raw physical transmission and logical network addressing. This layer is where data starts gaining meaningful structure for communication between devices on the same local network. It is important to understand that this layer does not deal with routing across different networks; instead, it focuses on reliable node-to-node delivery within a shared network segment.
How Layer 2 Organizes Local Communication
The data link layer ensures that devices connected on the same network can identify each other and exchange data without confusion. It uses hardware-based addressing, known as MAC addresses, to achieve this. Every network interface card has a unique MAC address, which allows switches to forward data precisely to the correct destination device within the same network.
Role of Switching in the OSI Model Chart
In OSI charts, switches are commonly placed at Layer 2 because they operate using MAC addresses rather than IP addresses. A switch reads the destination MAC address in a frame and forwards it only to the appropriate port. This reduces unnecessary traffic and improves network efficiency by preventing data from being broadcast to all devices.
Error Detection and Reliability at Layer 2
Another key function of the data link layer is error detection. When data is encapsulated into frames, a Frame Check Sequence is added. This allows the receiving device to verify whether the frame was corrupted during transmission. If an error is detected, the frame can be discarded or retransmitted depending on the protocol being used.
Understanding Media Access Control in OSI Charts
Media Access Control is an essential part of Layer 2 shown in OSI diagrams. It determines how devices access the shared communication medium. In networks where multiple devices compete for transmission, MAC protocols ensure that data collisions are minimized or avoided entirely. This coordination is essential in maintaining smooth communication in busy networks.
Transition from Layer 2 to Layer 3 in OSI Model Charts
As data moves upward in the OSI model, it transitions from hardware-based addressing to logical addressing. This is where Layer 3 begins to play a critical role. OSI charts typically show this transition clearly, indicating how frames are converted into packets when moving from the data link layer to the network layer.
Introduction to the Network Layer in OSI Model Charts
The network layer is one of the most important layers in OSI charts because it enables communication between different networks. While Layer 2 handles local delivery, Layer 3 is responsible for global communication across multiple networks, including the internet. This is where routing and logical addressing come into play.
Understanding IP Addressing in Layer 3
At the network layer, devices use IP addresses instead of MAC addresses. IP addresses provide a logical structure that helps identify devices across different networks. OSI charts often highlight this shift from physical addressing to logical addressing, which is essential for scalable communication across large systems.
Role of Routers in OSI Model Charts
Routers are the primary devices operating at Layer 3. They analyze IP addresses in packets and determine the best possible path for data to reach its destination. Unlike switches, which operate locally, routers connect multiple networks together and enable communication across the internet and large enterprise systems.
How Routing Works in the OSI Model
Routing is the process of selecting the most efficient path for data transmission. In OSI charts, this is represented by arrows or paths moving between different networks. Routers maintain routing tables that contain information about network destinations and the best paths to reach them. This ensures that data is delivered efficiently even in complex network environments.
Packet Structure at the Network Layer
At Layer 3, data is organized into packets. These packets contain IP headers that include source and destination IP addresses, time-to-live values, and other control information. This structure allows packets to be routed independently across different networks, even if they take different paths to reach the same destination.
Protocols Used at the Network Layer
Common protocols at this layer include IPv4, IPv6, and ICMP. These protocols define how devices communicate across networks. ICMP is often used for diagnostic purposes, such as checking connectivity between devices using tools like ping. OSI charts typically associate these protocols with Layer 3 to show their role in network communication.
Importance of Subnetting in OSI Model Understanding
Subnetting is a key concept in Layer 3 that is often reflected in OSI charts indirectly. It involves dividing a large network into smaller, manageable segments. This improves performance, enhances security, and makes IP address management more efficient. Understanding subnetting is essential for interpreting how data moves across complex network structures.
Transition from Layer 3 to Layer 4
Once data reaches the correct network, it moves from the network layer to the transport layer. OSI charts typically show this transition as packets being converted into segments or datagrams. This shift marks the beginning of end-to-end communication between applications running on different devices.
Introduction to the Transport Layer in OSI Charts
The transport layer is responsible for ensuring reliable communication between two endpoints. It manages data flow, error recovery, and segmentation of large data streams. In OSI model charts, this layer is often shown as the point where logical communication between applications begins to take shape.
Understanding Segmentation in Layer 4
Segmentation is the process of breaking large data into smaller chunks called segments. This allows data to be transmitted more efficiently across networks. Each segment is numbered so that it can be reassembled correctly at the destination. OSI charts highlight this process as a key function of the transport layer.
TCP and UDP in OSI Model Representation
Two major protocols operate at Layer 4: TCP and UDP. TCP provides reliable, connection-oriented communication by ensuring that all data segments are received correctly and in order. UDP, on the other hand, provides faster but less reliable communication by sending data without establishing a connection or guaranteeing delivery.
Difference Between TCP and UDP in OSI Charts
OSI model charts often represent TCP and UDP as contrasting protocols within the same layer. TCP is associated with reliability and error checking, while UDP is associated with speed and efficiency. This distinction helps explain why different applications choose different transport protocols based on their needs.
Flow Control and Error Handling at Layer 4
The transport layer also manages flow control, which ensures that data is sent at a rate the receiving device can handle. It also performs error recovery in TCP by retransmitting lost or corrupted segments. These mechanisms ensure smooth and reliable communication between systems.
Port Numbers and Their Role in OSI Charts
Port numbers are a key concept at the transport layer. They help identify specific applications running on a device. For example, web traffic uses specific port numbers that allow data to be directed to the correct application. OSI charts often show ports as part of the transport layer to highlight application-level communication.
Multiplexing in the Transport Layer
Multiplexing allows multiple applications to use the same network connection simultaneously. The transport layer manages this by assigning different port numbers to different data streams. This ensures that data from multiple applications does not get mixed up during transmission.
How OSI Charts Link Layers Together
As you move through an OSI model chart, each layer builds upon the previous one. The data link layer ensures local delivery, the network layer handles routing across networks, and the transport layer ensures reliable end-to-end communication. This layered structure is what makes modern networking scalable and efficient.
Importance of Understanding OSI Layer Relationships
Understanding how each layer interacts with others is crucial when reading OSI charts. It helps in identifying where problems occur and how data flows through a system. Instead of viewing each layer in isolation, it is important to see them as part of a connected system that works together to deliver data accurately.
Encapsulation Across Layer 2, 3, and 4
Encapsulation continues through Layers 2, 3, and 4 as data moves downward. Each layer adds its own headers, creating frames, packets, and segments. This structured layering ensures that data contains all necessary information for successful delivery and reassembly at the destination.
Growing Complexity in OSI Model Interpretation
As OSI charts progress from Layer 2 to Layer 4, the complexity of communication increases significantly. Each layer introduces more intelligence and control mechanisms, allowing networks to handle larger amounts of data and more complex communication patterns across global systems.
End of Part 2 Progression in OSI Understanding
At this stage of understanding OSI model charts, the focus shifts from local data handling to global routing and reliable end-to-end communication. The next layers build upon this foundation by introducing session management, data formatting, and user-level application interaction.
Understanding the Session Layer in OSI Model Charts
When reading an OSI model chart, the session layer represents a shift from transport-based delivery to managing communication sessions between applications. This layer is responsible for establishing, maintaining, and terminating connections between two devices. It ensures that communication sessions remain organized so that data exchange happens smoothly without interruption or confusion.
Role of Session Management in Communication
The session layer is responsible for controlling the dialogue between two systems. It decides when communication starts, how long it continues, and when it should end. In OSI model charts, this layer is often shown as a bridge between transport-level delivery and higher-level application processes. It keeps interactions structured, especially in long-running connections.
Session Establishment and Termination Process
One of the main functions of this layer is session establishment. This involves setting up a logical connection between two applications before data transfer begins. Once the communication is complete, the session layer ensures that the connection is properly closed. This prevents data loss and ensures system resources are freed efficiently.
Checkpointing and Recovery in the Session Layer
The session layer also supports checkpointing, which allows data transfers to resume from a specific point if the connection is interrupted. This is especially useful in large file transfers or long sessions. OSI charts may represent this concept as a mechanism that adds reliability beyond the transport layer by ensuring continuity in communication.
Session Layer Interaction with Other Layers
In OSI model charts, the session layer sits between the transport and presentation layers. It relies on the transport layer for reliable delivery but adds additional control over how sessions are managed. This interaction ensures that data is not only delivered correctly but also organized within meaningful communication sessions.
Understanding the Presentation Layer in OSI Charts
The presentation layer is responsible for transforming data into a format that can be understood by both the sender and receiver. It acts as a translator between the application layer and the lower layers of the OSI model. In charts, this layer is often associated with data formatting, encryption, and compression functions.
Data Formatting and Standardization
One of the key responsibilities of the presentation layer is ensuring that data is formatted correctly. Different systems may use different encoding standards, so this layer ensures compatibility. Whether it is text, images, or multimedia, the presentation layer ensures that data is correctly interpreted on both ends of communication.
Encryption and Security Functions
The presentation layer also plays a role in securing data through encryption and decryption. When data is sent, it may be encrypted to protect it from unauthorized access. At the receiving end, it is decrypted so that it can be read. OSI charts often show this layer as a critical point for data security and privacy.
Compression and Efficiency in Data Transfer
Another important function of the presentation layer is compression. By reducing the size of data before transmission, it improves network efficiency and reduces bandwidth usage. Once the data reaches its destination, it is decompressed back into its original form. This process is often illustrated in OSI charts as part of data optimization.
Encoding and Decoding in Layer 6
The presentation layer handles encoding and decoding of data formats such as ASCII, JPEG, and MPEG. This ensures that data created on one system can be correctly interpreted on another system, even if they use different internal formats. OSI charts highlight this role to show how data becomes universally readable.
Transition from Presentation to Application Layer
After data is formatted and prepared by the presentation layer, it moves to the application layer. In OSI model charts, this transition represents the final stage before user interaction. At this point, data is fully prepared for applications such as web browsers, email clients, or file transfer programs.
Understanding the Application Layer in OSI Charts
The application layer is the topmost layer in the OSI model. It is the layer that users interact with directly through software applications. OSI charts often depict this layer as the interface between human users and the underlying network communication system.
Role of User Interaction in Layer 7
The application layer provides services that allow users to access network resources. This includes web browsing, email communication, file sharing, and remote access. It does not deal with data transmission itself but provides the tools and protocols that enable communication between applications.
Common Protocols at the Application Layer
Many familiar protocols operate at this layer, including HTTP for web browsing, FTP for file transfers, SMTP for email sending, and DNS for domain name resolution. OSI charts often list these protocols to show how everyday internet activities are supported by the application layer.
How Applications Use the OSI Model
Applications rely on lower OSI layers to send and receive data. For example, when a user sends an email, the application layer formats the message, the presentation layer encodes it, the session layer manages the connection, and the lower layers handle transmission. OSI charts help visualize this complete flow.
Data Flow from Application to Physical Layer
In OSI model charts, data flows downward from the application layer to the physical layer before transmission. Each layer adds its own information to the data, ensuring proper delivery. This structured flow is essential for maintaining accuracy and reliability in communication systems.
Reverse Data Flow in OSI Charts
When data is received, it flows upward from the physical layer back to the application layer. Each layer removes its added information and processes the data accordingly. OSI charts often illustrate this reverse flow to show how raw signals are transformed back into readable information.
Importance of Upper Layers in User Experience
The upper layers of the OSI model (session, presentation, and application) directly impact user experience. They determine how data is displayed, how sessions are maintained, and how applications communicate. OSI charts emphasize these layers to show their importance in real-world usage.
Relationship Between OSI Model and TCP/IP Model
OSI model charts are often compared with the TCP/IP model. While the OSI model separates functions into seven distinct layers, the TCP/IP model groups them into fewer layers. Understanding this comparison helps in interpreting OSI charts more effectively and recognizing how theoretical models relate to real-world networking.
Practical Interpretation of OSI Charts
In real-world networking, OSI charts are used more as a conceptual guide than an exact implementation model. Devices and protocols often operate across multiple layers simultaneously. OSI charts help simplify this complexity by breaking down communication into structured steps.
Importance of Abstraction in OSI Model
Abstraction is a key concept in OSI charts. Each layer hides its internal processes from other layers, allowing systems to function independently. This makes network design more flexible and easier to manage, especially in large-scale environments.
Real-World Example of OSI Layer Interaction
When accessing a website, the application layer handles the browser request, the presentation layer formats data, the session layer manages the connection, the transport layer ensures delivery, the network layer routes packets, the data link layer handles local delivery, and the physical layer transmits signals. OSI charts help visualize this complete journey.
Understanding OSI Charts for Troubleshooting
One of the most practical uses of OSI model charts is troubleshooting network issues. By identifying which layer a problem occurs in, IT professionals can quickly isolate and resolve issues. For example, no internet connection could indicate a physical layer issue or a network layer routing problem.
Increasing Complexity Across OSI Layers
As we move upward in the OSI model, complexity increases from simple signal transmission to complex application interactions. OSI charts visually represent this progression, helping learners understand how simple data evolves into meaningful user information.
Understanding the Full Flow of the OSI Model Chart
When you reach the final stage of learning how to read an OSI model chart, the most important idea is to see all seven layers as one continuous system rather than separate parts. Each layer plays a specific role, but they all work together to move data from one device to another. The chart is essentially a visual map of how information travels through a network in a structured and predictable way.
How Data Moves as a Complete Process
In an OSI model chart, data does not stay in one form. It constantly changes as it moves through layers. It starts as user-generated information at the application layer, becomes formatted data, then structured into segments, packets, frames, and finally bits at the physical layer. On the receiving side, this process is reversed until the original message is restored. This transformation is what makes digital communication possible.
Understanding Encapsulation as a Full Cycle
Encapsulation is one of the most important ideas in OSI model charts. Every layer adds its own header information to the data as it moves downward. This ensures that each layer knows how to handle the data correctly. When data reaches its destination, each layer removes its header in reverse order. This full cycle of encapsulation and de-encapsulation is what keeps communication organized and reliable.
Why OSI Charts Show a Layered Structure
The layered structure in OSI charts is not random. It is designed to simplify extremely complex networking processes. Instead of treating communication as one large system, it breaks it into smaller, manageable functions. Each layer focuses on a specific job, which makes it easier to design, troubleshoot, and understand network behavior.
How to Interpret OSI Charts in Real Situations
When reading an OSI model chart in real-world scenarios, it helps to imagine a message traveling step by step. For example, when you send a message or open a website, each layer processes the data in sequence. The chart is a visual guide that shows this journey clearly, helping you connect theory with real network activity.
Layer Interaction as a Unified System
Although OSI layers are shown separately in charts, they constantly interact with each other. A change in one layer affects the others. For example, if the network layer fails, transport and application layers cannot function properly. OSI charts help visualize this dependency so you can understand how tightly connected the system really is.
Importance of Direction in OSI Model Charts
One key aspect of reading OSI charts is understanding direction. Data moves downward when it is being sent and upward when it is being received. This dual-direction flow is essential for communication. The chart helps visualize this by showing a top-to-bottom and bottom-to-top movement, representing sending and receiving processes.
Common Misunderstandings About OSI Charts
Many learners assume that each layer operates independently in real systems, but that is not entirely true. In reality, modern networking devices often handle multiple layers at once. OSI charts are simplified models designed for learning and troubleshooting, not exact representations of hardware behavior.
Practical Use of OSI Model Knowledge
Understanding OSI charts is extremely useful in IT careers. It helps in diagnosing network issues, designing systems, and understanding how different technologies interact. Instead of guessing where a problem is, professionals can use OSI layers to pinpoint the exact stage where communication is failing.
Troubleshooting Using OSI Model Charts
One of the strongest uses of OSI charts is troubleshooting. If there is no network connectivity, technicians can check from bottom to top. If cables are fine, they move to the data link layer. If MAC addresses are working, they move to the network layer, and so on. This step-by-step method makes problem-solving more efficient and logical.
Real-World Example of OSI Layer Breakdown
When a user sends an email, the application layer handles the email software, the presentation layer formats the message, the session layer manages the connection, the transport layer ensures delivery, the network layer routes the message, the data link layer handles local delivery, and the physical layer transmits signals. OSI charts help break this entire process into understandable steps.
Understanding Data Transformation Across Layers
Another important idea in OSI charts is that data changes form at every stage. It is not simply passed along; it is modified, wrapped, and interpreted differently at each layer. This transformation ensures that data can travel across different types of networks and still arrive correctly.
Why OSI Model is Still Important Today
Even though modern networks often use the TCP/IP model, OSI charts remain important for learning and understanding networking concepts. They provide a clear structure that helps beginners and professionals understand how communication systems are built and how they function internally.
Simplifying OSI Charts for Better Understanding
A simple way to remember OSI charts is to group the layers into categories. The lower layers handle hardware and transmission, the middle layers handle routing and reliability, and the upper layers handle user interaction and data formatting. This grouping makes the model easier to understand and apply.
Key Insight from OSI Model Structure
The biggest takeaway from OSI model charts is that networking is a structured process, not a random flow of data. Every step is defined, and every layer has a specific responsibility. This structured approach is what allows millions of devices worldwide to communicate seamlessly.
Final Interpretation of OSI Model Charts
When you fully understand OSI charts, you stop seeing them as just diagrams and start seeing them as a complete communication system. They represent how data travels from human interaction to electrical signals and back again in a controlled, organized way.
Conclusion
Learning how to read an OSI model chart gives you a strong foundation in networking. It helps you understand how devices communicate, how data moves across networks, and how problems can be identified and solved. While it may seem complex at first, breaking it down layer by layer makes it much easier to understand and apply in real-world situations.