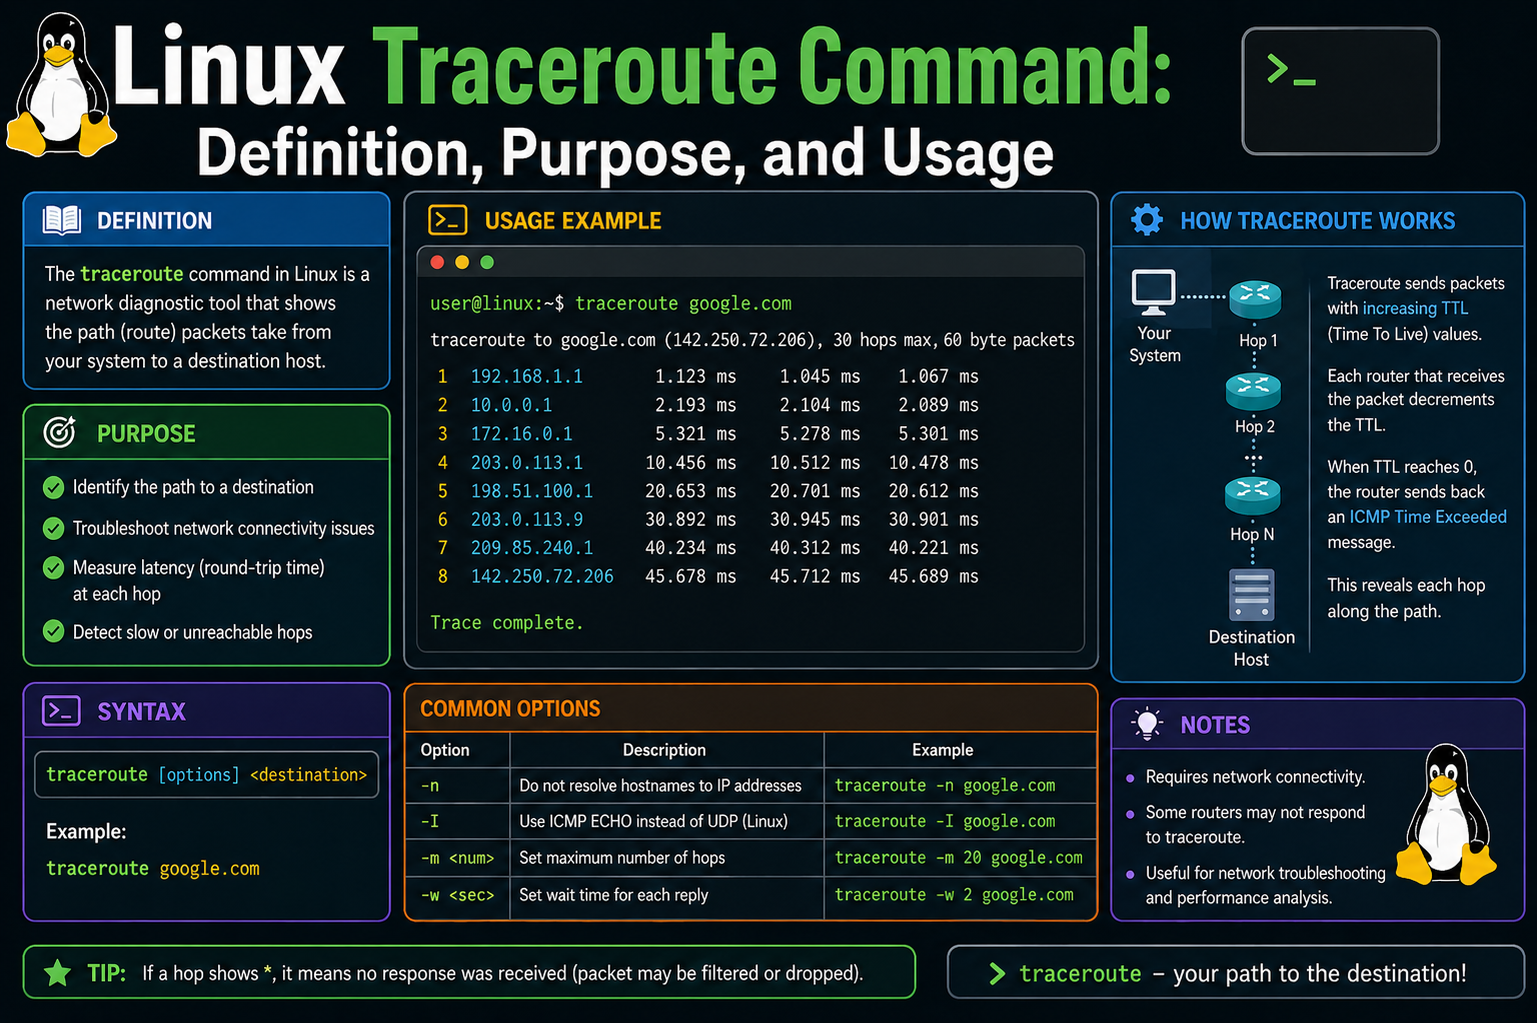
The traceroute command is a powerful built-in Linux networking utility designed to reveal the exact path that data packets travel from a source system to a destination host or IP address. In simple terms, it shows each step, or “hop,” that network traffic takes as it moves across routers and gateways until it reaches its final destination. This makes it an essential tool for diagnosing connectivity problems, understanding routing behavior, and analyzing network delays.
Unlike basic connectivity tools that only confirm whether a destination is reachable, traceroute provides a detailed map of the journey. It not only tells you whether a destination responds but also exposes every intermediate device involved in delivering the packet. This level of visibility is extremely valuable in troubleshooting slow connections, identifying misconfigured routers, and detecting points of failure in a network path.
Traceroute is commonly used by system administrators, network engineers, and IT support professionals because it simplifies the process of identifying where communication delays or failures occur. Instead of guessing where a network issue might be located, traceroute provides a structured, step-by-step breakdown of the route taken by packets.
Understanding the Core Purpose of Traceroute
The primary purpose of traceroute is to map the route between two network endpoints. Every time data moves across the internet or a private network, it passes through multiple devices such as routers, switches, and gateways. Each of these devices is considered a hop. Traceroute identifies each hop in sequence and reports how long it takes for packets to reach and return from each one.
This information helps answer important questions during troubleshooting. For example, if a website is loading slowly, traceroute can help determine whether the delay is happening inside the local network, somewhere in the internet service provider’s infrastructure, or closer to the destination server. Without such a tool, identifying the exact location of a network issue would require much more complex investigation.
Traceroute is also helpful for understanding network structure. Large networks often have multiple possible paths between two points. The tool reveals which specific path is being used at that moment, which can change dynamically based on traffic conditions and routing decisions.
How Traceroute Works at a Technical Level
Traceroute operates by using a clever mechanism involving packet lifetime control. Each network packet contains a field known as Time To Live, often abbreviated as TTL. This value determines how long a packet is allowed to exist before it is discarded by a router.
When a packet passes through a router, the TTL value is reduced by one. If the TTL reaches zero, the router discards the packet and sends back an error message indicating that the packet expired. Traceroute uses this behavior intentionally to discover each hop along the route.
At the beginning of a traceroute operation, a packet is sent with a TTL value of one. This means the first router that receives it will immediately reduce the TTL to zero and discard the packet. When this happens, the router responds back with a notification message indicating that the packet could not continue further. This response reveals the identity and address of the first hop.
Next, traceroute sends another packet, this time with a TTL value of two. This allows it to pass through the first router and reach the second one. The second router then reduces the TTL to zero, discards the packet, and sends back a response. This process continues repeatedly, increasing the TTL value step by step, allowing traceroute to uncover each hop along the path.
This incremental approach continues until the packet finally reaches the destination system. Once the destination is reached, it responds normally instead of sending a TTL expiration message, signaling the end of the route discovery process.
What Makes Traceroute Valuable in Networking
The real strength of traceroute lies in the level of insight it provides into network behavior. Instead of simply confirming whether a connection works or fails, it reveals where delays or interruptions occur. This makes it much easier to isolate issues in complex network environments.
One of the most important benefits is latency measurement. Each hop in the traceroute output includes timing information that shows how long it takes for a packet to travel to that hop and return. This helps identify where delays are introduced in the network path. If one hop shows significantly higher response times compared to others, it may indicate congestion or performance issues at that point.
Another key benefit is fault isolation. When a connection fails, traceroute can help determine the exact point where communication stops. If packets reach a certain hop but do not continue further, it suggests that the issue lies beyond that point. This allows administrators to focus troubleshooting efforts more effectively.
Traceroute also helps in understanding routing behavior. In modern networks, data does not always take the same path every time. Routing systems may choose different paths based on load balancing or network conditions. Traceroute makes these decisions visible by showing the actual path taken during each test.
Role of Traceroute in Linux Environments
In Linux systems, traceroute is widely available and commonly used as part of standard network diagnostic tools. It is typically included by default in most distributions, making it easily accessible without additional installation in many cases.
Within Linux environments, traceroute is often used alongside other diagnostic utilities to build a complete picture of network performance. While tools like ping can confirm basic connectivity, traceroute expands on this by revealing the entire communication path.
Linux administrators frequently rely on traceroute when dealing with server connectivity issues, remote access problems, or slow network performance. Since Linux systems are often used in server environments, having detailed visibility into network routes is especially important for maintaining uptime and performance.
Why Network Paths Are Important to Understand
Every network connection follows a series of interconnected devices before reaching its destination. These devices are not always under the control of a single organization. As a result, understanding the route becomes essential when diagnosing issues that may involve multiple networks.
If a problem occurs between two distant systems, it is not always obvious where the fault lies. It could be within the local network, within an internet service provider’s infrastructure, or even within the destination network itself. Traceroute helps break down this uncertainty by showing exactly where communication slows or stops.
This visibility is particularly important in large-scale environments where traffic flows through many different systems. Without tools like traceroute, diagnosing such issues would require significantly more time and effort.
What Happens When a Traceroute Is Executed
When a traceroute command is executed on a Linux system, several processes begin in the background. First, the system prepares a series of network packets designed specifically for route discovery. These packets are then sent toward the destination address one by one with increasing TTL values.
As each packet travels through the network, routers along the path process it according to standard networking rules. When a router detects that the TTL has reached zero, it responds back to the originating system with a message indicating where the packet expired.
The Linux system then records this information and organizes it into a structured output. Each hop is displayed in sequence, showing its position in the route, its network address, and the time taken for the response. This continues until the destination is reached or until the maximum number of hops is exceeded.
Importance of Incremental Hop Discovery
The step-by-step nature of traceroute is what makes it especially effective. Instead of attempting to guess the entire path at once, it builds the route gradually, ensuring accuracy at each stage. This incremental discovery method reduces uncertainty and allows precise identification of each intermediate device.
Each hop provides a snapshot of a specific point in the network journey. By combining these snapshots, a complete picture of the entire route is formed. This layered approach is what distinguishes traceroute from simpler connectivity tools.
The incremental process also ensures that even partial failures can be analyzed. If the trace stops at a certain point, the last successful hop provides a clear indication of how far the packet traveled before encountering an issue.
Relevance of Traceroute in Modern Networking
Modern networks are complex, dynamic, and highly distributed. Data often travels across multiple autonomous systems before reaching its destination. This complexity makes it difficult to understand performance issues without specialized tools.
Traceroute remains relevant because it provides transparency in an otherwise hidden process. Even though network infrastructure continues to evolve, the need to understand routing paths and diagnose connectivity problems remains constant.
It also plays an important role in performance optimization. By analyzing traceroute results, network engineers can identify inefficient routing paths and work toward improving overall network efficiency.
Deeper Insight into Packet Movement Across Networks
To fully understand traceroute, it is important to look more closely at how data actually moves across networks. Every time you access a website, send a request, or connect to a remote server, your data is broken into small units called packets. These packets do not travel in a straight, fixed line. Instead, they pass through multiple interconnected systems, each making independent routing decisions.
Traceroute takes advantage of this behavior by observing how each packet is handled at every stage of its journey. Rather than focusing only on the final destination, it reveals every intermediate stop. This is what makes it such a powerful diagnostic tool in Linux networking environments.
Each intermediate device in the path performs a simple but important task. It reads the packet, checks its TTL value, reduces it, and then decides whether to forward it or discard it. This process repeats across all routers until the packet either reaches its destination or expires. Traceroute uses this mechanism to uncover the full structure of the route.
Understanding Time To Live in Practical Terms
The Time To Live value is often misunderstood, but it plays a central role in traceroute operations. In practical terms, TTL is not about time in seconds, but rather about hop limits. It represents how many routers a packet is allowed to pass through before being discarded.
This mechanism exists to prevent packets from circulating endlessly in case of routing errors. Without TTL, a misrouted packet could loop indefinitely within a network, consuming resources unnecessarily.
Traceroute intentionally manipulates this value to trigger responses from each router along the path. By carefully increasing TTL one step at a time, it forces every router to reveal itself in sequence. This controlled approach is what allows the tool to build a complete path map.
Each response generated by a router includes useful diagnostic data. This includes the router’s identity, its network address, and the time taken to respond. Collectively, this information becomes a detailed breakdown of the network structure.
The Role of ICMP and Response Messages
In most Linux systems, traceroute relies heavily on ICMP-based responses. ICMP is a protocol used by network devices to send error messages and operational information. When a packet expires due to TTL reaching zero, the router sends back an ICMP message indicating the issue.
These messages are not errors in the traditional sense. Instead, they are intentional signals used for communication between network devices. Traceroute uses these signals to identify each hop along the route.
When the packet eventually reaches its final destination, a different type of response is generated. Instead of a TTL expiration message, the destination system replies normally, confirming successful delivery. This marks the end of the trace process.
The combination of ICMP responses and TTL manipulation creates a structured way to observe network behavior without requiring special configuration on intermediate devices.
How Routers Respond During a Trace Operation
Each router encountered during a traceroute operation performs a predictable set of actions. First, it checks the TTL value of the incoming packet. If the value is greater than zero, it reduces it by one and forwards the packet to the next hop. If the value becomes zero, the packet is discarded.
At the moment of discarding the packet, the router generates a response message and sends it back to the origin system. This response is what traceroute captures and records.
The response includes important metadata that helps identify the router. Even if the router does not explicitly reveal a hostname, its IP address is always included. This allows administrators to trace the physical or logical path of the packet across networks.
In some cases, routers may be configured not to respond to ICMP messages. When this happens, traceroute may display gaps or timeouts in the output. This does not necessarily mean the network is broken, but rather that the device is configured to ignore such requests.
Understanding Hop-by-Hop Visibility
Hop-by-hop visibility is one of the most valuable aspects of traceroute. Instead of viewing the network as a single connection between two points, traceroute breaks it down into individual segments.
Each hop represents a transition between two network devices. These transitions are where routing decisions are made, and where delays or issues may occur. By analyzing each hop separately, it becomes possible to identify exactly where performance changes happen.
For example, if the first few hops show low latency but later hops show significant delays, it indicates that the issue lies deeper within the network path rather than near the source. This level of precision is critical in large-scale environments.
Hop analysis also helps in identifying unexpected routing behavior. Sometimes data may travel through longer or indirect routes due to network policies or congestion. Traceroute makes these deviations visible.
How Network Topology Becomes Visible Through Traceroute
Network topology refers to the arrangement and structure of interconnected devices within a network. Normally, this structure is hidden from end users. However, traceroute provides a partial view of this topology by revealing the sequence of routers involved in a connection.
Although it does not show the entire internal structure of each network, it exposes the external path between networks. This is particularly useful when dealing with internet-scale communication, where data passes through multiple independent organizations.
By analyzing traceroute results, one can infer how different networks are connected and how traffic flows between them. This is especially useful in diagnosing cross-network performance issues.
Understanding topology through traceroute also helps in identifying redundancy and alternative routing paths. Some networks may have multiple possible routes, and traceroute may reveal which one is currently active.
Why Latency Varies Across Different Hops
One of the most important observations in traceroute output is variation in response time. Each hop may show different latency values depending on several factors.
One factor is distance. Packets traveling longer physical or logical distances naturally take more time to respond. Another factor is network congestion. If a router is handling a large volume of traffic, its response time may increase.
Processing capacity also plays a role. Some routers are designed for high-speed backbone traffic, while others may handle smaller loads. Differences in hardware performance can affect response times.
Additionally, routing policies can influence latency. Some paths may be prioritized over others, causing uneven performance across hops.
Traceroute helps identify these variations clearly by displaying timing information for each hop. This makes it easier to pinpoint where delays begin.
Behavior of Intermediate Devices During Trace Operations
Intermediate devices such as routers and gateways do not need special configuration to participate in traceroute operations. They simply respond according to standard networking protocols.
However, their behavior can vary depending on security settings. Some devices may be configured to limit or block ICMP responses for security reasons. In such cases, traceroute may show incomplete information.
Even when responses are blocked, the absence of data itself can be meaningful. It may indicate firewall restrictions or security policies that prevent certain types of network visibility.
Understanding this behavior is important when interpreting traceroute results, as missing responses do not always indicate a failure.
How Traceroute Builds a Visual Path Representation
Although traceroute is a command-line tool, its output effectively creates a visual representation of a network path. Each line corresponds to a hop, and each hop represents a step in the journey.
This structured format makes it easier to understand complex routing behavior without needing graphical tools. The sequential nature of the output allows users to follow the path step by step.
Over time, repeated traceroute tests can also reveal changes in routing behavior. This is useful for monitoring network stability and detecting unusual shifts in traffic patterns.
By comparing multiple traces, administrators can determine whether network paths remain consistent or vary over time.
Impact of Routing Decisions on Traceroute Results
Routing decisions made by network devices directly influence traceroute output. These decisions are based on routing tables, network policies, and real-time conditions.
Because of this, traceroute results may change depending on when the command is executed. A different route may be chosen during periods of high traffic or network reconfiguration.
This dynamic behavior reflects the adaptive nature of modern networks. Instead of fixed paths, traffic often flows through the most efficient available route at the time.
Traceroute captures these dynamic changes, providing a real-time snapshot of network behavior.
Understanding Packet Delay and Jitter in Network Paths
When analyzing traceroute results, one of the most important aspects to observe is variation in response times across different hops. These variations are not always consistent and can fluctuate depending on network load, routing conditions, and device performance. This fluctuation is often referred to as jitter, while overall delay is commonly known as latency.
Latency represents the time it takes for a packet to travel from one point to another and return. In traceroute output, each hop shows multiple response times, which help reveal how stable or unstable that segment of the network is. If response times remain relatively consistent, it suggests a stable connection between those devices. However, if response times vary widely, it may indicate congestion or unstable routing behavior.
Jitter becomes especially important in real-time applications such as voice communication or video streaming. Even if a network connection is technically functional, high jitter can cause noticeable performance issues. Traceroute helps identify where these inconsistencies begin, making it easier to isolate problematic segments within the network path.
By observing patterns across multiple hops, it becomes possible to distinguish between localized issues and broader network instability. This makes traceroute a valuable diagnostic tool for performance analysis beyond simple connectivity checks.
Role of Network Congestion in Traceroute Behavior
Network congestion occurs when too much traffic passes through a specific router or link, exceeding its processing capacity. When this happens, packets may experience delays, queueing, or even temporary drops. Traceroute can reveal these conditions indirectly by showing increased response times at affected hops.
When a router is congested, it may take longer to process incoming packets and generate responses. This delay is reflected in traceroute output as higher latency values for that specific hop. If congestion is temporary, the delay may fluctuate across different runs of the command.
In some cases, congestion may occur deeper in the network rather than near the source. Traceroute helps identify the exact location where performance degradation begins, which is critical for resolving large-scale network issues.
Understanding congestion patterns also helps in capacity planning. By analyzing repeated traceroute results, network engineers can determine whether infrastructure upgrades are needed to handle traffic more efficiently.
How Load Balancing Affects Traceroute Output
Modern networks often use load balancing techniques to distribute traffic across multiple paths. This improves performance and reliability by preventing any single route from becoming overloaded. However, load balancing can also introduce complexity into traceroute results.
When load balancing is active, different packets in the same traceroute session may take different routes. This can result in varying hop sequences or inconsistent response times. As a result, traceroute output may appear less linear than expected.
Some hops may alternate between different routers, depending on how traffic is distributed at that moment. This behavior is normal in advanced network environments but can make interpretation more challenging.
Despite this variability, traceroute still provides valuable insights. By running multiple traces over time, patterns can be observed that reveal how traffic is being distributed across the network.
Load balancing also highlights the dynamic nature of modern routing systems. Instead of relying on fixed paths, networks continuously adjust routes based on performance and availability.
Understanding Packet Loss in Traceroute Results
Packet loss occurs when one or more packets fail to reach their destination or do not receive a response. In traceroute output, this is often represented by missing responses or asterisks in place of timing values.
Packet loss can happen for several reasons. One common reason is network congestion, where routers are too busy to process all incoming packets. Another reason may be security configurations that block or ignore certain types of diagnostic traffic.
It is important to understand that packet loss in traceroute does not always indicate a broken connection. Some routers are configured not to respond to traceroute requests even though they still forward traffic normally.
However, consistent packet loss across multiple hops or repeated tests may indicate a more serious issue. It could suggest faulty hardware, misconfigured routing, or unstable network links.
Traceroute helps identify where packet loss begins, which is essential for isolating the root cause of connectivity problems.
Interpreting Asterisks and Missing Responses
In traceroute output, asterisks are often used to indicate missing responses from a hop. This means that the system did not receive a reply within the expected time frame.
There are several possible reasons for this behavior. The most common is that the router is configured not to respond to traceroute probes. Many network devices prioritize forwarding traffic over responding to diagnostic requests.
Another possibility is that the response was delayed beyond the timeout threshold set by the traceroute command. In such cases, the packet may have reached the router, but the response arrived too late to be recorded.
Repeated asterisks at the same hop across multiple attempts may indicate a firewall or filtering rule blocking ICMP responses. However, if subsequent hops still respond, it suggests that traffic is still flowing beyond that point despite the missing reply.
Understanding these patterns is important to avoid misinterpreting traceroute results as network failures.
Tracing Routes Across Multiple Autonomous Systems
The internet is composed of many independent networks known as autonomous systems. Each of these systems operates under different administrative control and routing policies. When data travels across the internet, it often passes through multiple autonomous systems before reaching its destination.
Traceroute helps reveal transitions between these systems by showing changes in routing paths. Each hop may belong to a different provider or organization, and these transitions can sometimes be identified through hostname patterns or IP address ranges.
These cross-network transitions are critical points in the communication path. They often represent boundaries where routing policies change or where traffic is handed off between providers.
By analyzing these transitions, it becomes possible to understand how data moves across the global internet infrastructure. This insight is particularly useful when diagnosing issues involving external services or remote servers.
Behavior of DNS Resolution in Traceroute
In many traceroute outputs, hostnames are displayed alongside IP addresses. These hostnames are resolved using DNS lookups, which translate numerical IP addresses into readable domain names.
While this makes output easier to interpret, it can also introduce delays during execution. Each DNS lookup requires additional time and network communication, which may slow down traceroute results.
In some cases, DNS resolution may fail, resulting in only IP addresses being displayed. This does not affect the accuracy of the route itself, only the readability of the output.
Because of this, many users choose to disable DNS resolution when running traceroute for faster and cleaner results. This helps focus on raw network behavior without additional overhead.
Understanding Maximum Hop Limits
Traceroute includes a maximum hop limit to prevent endless searches in case a destination cannot be reached. This limit defines how many routers the command will attempt to traverse before stopping.
If the destination is farther away than the configured limit, traceroute will terminate without reaching the target. This helps prevent unnecessary resource usage and ensures the command completes in a reasonable amount of time.
In most cases, the default hop limit is sufficient for typical network paths. However, in complex or global networks, adjusting this limit may be necessary to fully trace long routes.
If the limit is reached before the destination responds, it often indicates either a very long routing path or a failure somewhere along the way.
How Security Policies Influence Traceroute Visibility
Network security policies can significantly affect traceroute results. Many organizations implement firewalls or filtering systems that restrict diagnostic traffic for security reasons.
These restrictions may prevent ICMP responses or block traceroute packets entirely. As a result, certain hops may not appear in the output even though traffic is still passing through those devices.
Security-focused configurations are common in enterprise environments where limiting network visibility is part of protecting infrastructure.
Despite these limitations, traceroute remains useful because it still reveals partial paths and performance behavior up to the point where restrictions begin.
Understanding these security influences is essential for correctly interpreting incomplete or filtered traceroute results.
Practical Importance of Route Stability
Route stability refers to how consistently data follows the same path over time. Stable routes are generally more reliable and predictable, while unstable routes may change frequently due to network conditions.
Traceroute helps measure this stability by allowing repeated observations of the same destination. If the path remains consistent across multiple tests, it indicates stable routing behavior.
If the path changes frequently, it may suggest dynamic routing adjustments, load balancing, or underlying network instability.
Route stability is especially important for applications that require consistent performance, such as online services, remote servers, and communication systems.
By analyzing traceroute data over time, administrators can gain a deeper understanding of how stable their network connections truly are.
Understanding Long-Distance Routing Across the Internet
When data travels across the internet, it often crosses vast geographic distances and passes through multiple independent networks before reaching its destination. Traceroute makes this invisible journey visible by breaking it into a sequence of measurable steps. Each step represents a transition between different network points, allowing you to understand how data moves across regions, providers, and infrastructure layers.
In long-distance routing, packets may pass through several countries, backbone networks, and exchange points. Each of these transitions introduces potential changes in latency and routing behavior. Traceroute helps expose these transitions by showing where delays begin to increase or where routing paths shift unexpectedly.
This is especially useful when diagnosing performance issues involving remote servers. A slow response may not be caused by the destination itself but by an intermediate network segment far away from the user’s location. Traceroute helps pinpoint these distant problem areas with precision.
By examining the full route, it becomes possible to understand not just where data is going, but how efficiently it is reaching its destination.
Role of Internet Service Providers in Routing Paths
Internet service providers play a central role in determining how data travels between networks. Each provider maintains its own internal infrastructure and routing policies, which influence the path traceroute reveals.
When packets move from one provider to another, they pass through interconnection points. These points are critical because they represent transitions between independently managed systems. Any delay or misconfiguration at these points can significantly affect overall performance.
Traceroute often shows changes in hostname patterns or IP address ranges at these boundaries, indicating a shift from one provider’s network to another. These transitions are key indicators of where responsibility changes between networks.
Understanding how different providers handle routing helps in diagnosing whether a performance issue is local, regional, or external. It also helps in identifying whether delays are caused by internal infrastructure or external network dependencies.
How Asynchronous Routing Impacts Trace Results
Modern networks do not always follow symmetric paths. This means that the route taken by packets traveling from source to destination may differ from the route taken when returning. This behavior is known as asymmetric routing.
Traceroute primarily shows the forward path from source to destination. However, response packets may return through different routes, which can sometimes create variations in timing or hop visibility.
Asynchronous routing is common in large-scale networks where multiple paths exist between two points. It improves efficiency and redundancy but can make network analysis more complex.
Because traceroute measures response times based on return packets, differences in routing paths can sometimes lead to inconsistent timing results. Understanding this behavior is important when interpreting traceroute data in environments with complex routing architectures.
Understanding Gateway Transitions in Network Paths
Gateways act as entry and exit points between different networks. Every time a packet moves from one network segment to another, it passes through a gateway device. Traceroute captures these transitions as distinct hops.
These gateway transitions are important because they often represent the boundaries between different administrative domains. Each domain may have its own routing rules, performance characteristics, and security policies.
By observing where gateway transitions occur, it becomes possible to identify structural changes in the network path. These transitions often correlate with changes in latency or routing behavior.
Gateway analysis also helps in understanding how traffic is distributed across multiple network segments. In some cases, multiple gateways may exist between two networks, providing alternative routes for traffic flow.
Behavior of Intermediate Networks During High Traffic Conditions
During periods of high network usage, intermediate systems may behave differently than under normal conditions. Routers may prioritize certain types of traffic, delay responses, or temporarily drop low-priority packets.
Traceroute can indirectly reveal these conditions by showing increased response times or inconsistent hop behavior. If a particular hop shows fluctuating latency across multiple tests, it may indicate congestion during peak usage periods.
High traffic conditions can also cause temporary routing changes. Networks may redirect traffic through alternative paths to balance load, which can result in different traceroute outputs at different times.
These dynamic behaviors are normal in large-scale networks, but they are important to understand when analyzing performance issues.
Understanding Why Some Hops Remain Invisible
In some traceroute outputs, certain hops may not appear at all. This can happen for several reasons, most commonly due to security configurations or intentional filtering.
Some network devices are configured to ignore diagnostic requests to reduce exposure or prevent misuse. In such cases, traceroute cannot obtain a response from those devices, even though they are actively forwarding traffic.
Another reason for missing hops is that intermediate devices may not decrement TTL in a way that triggers a response. Instead, they may silently pass packets along without generating diagnostic messages.
Even when hops are invisible, traceroute can still provide useful information by showing surrounding responding devices. This allows partial reconstruction of the network path.
Understanding this limitation is important because missing data does not necessarily indicate a failure in the network.
How Routing Policies Shape Network Behavior
Routing policies define how network traffic is directed between different systems. These policies are based on performance, cost, reliability, and administrative decisions.
Traceroute indirectly reflects these policies by showing the actual path selected for packet delivery. Different policies can result in different routes even when the source and destination remain the same.
For example, a network may prefer a longer but more stable route over a shorter but congested one. Alternatively, it may prioritize cost-efficient routes over performance-optimized ones.
These decisions are made dynamically by routing protocols that continuously evaluate network conditions. Traceroute captures the outcome of these decisions in real time.
By analyzing routing patterns, it becomes possible to understand how network policies influence actual data movement.
Importance of Baseline Measurements in Network Diagnostics
One of the most effective ways to use traceroute is by establishing baseline measurements. A baseline represents the normal behavior of a network path under typical conditions.
By running traceroute regularly to the same destination, it becomes possible to understand what a healthy route looks like. This includes expected hops, typical latency values, and stable routing paths.
When an issue occurs, comparing current traceroute results with baseline data helps quickly identify deviations. These deviations may include new hops, increased latency, or altered routing paths.
Without a baseline, it becomes much harder to determine whether a network condition is abnormal or simply part of normal variation.
Baseline tracking is especially useful in environments where performance consistency is important, such as server hosting or enterprise networks.
Understanding Temporary vs Persistent Network Issues
Traceroute is useful for distinguishing between temporary and persistent network problems. Temporary issues may appear as occasional spikes in latency or brief packet loss at certain hops.
These short-lived issues often resolve themselves and may be caused by momentary congestion or routing adjustments. Persistent issues, on the other hand, appear consistently across multiple traceroute runs.
If the same hop repeatedly shows high latency or packet loss, it suggests a deeper underlying problem. This could involve hardware failure, misconfiguration, or sustained congestion.
By comparing multiple traceroute results over time, it becomes easier to categorize network behavior as stable, temporary, or consistently problematic.
Interpreting Complex Multi-Path Routing Environments
In modern networks, especially large-scale systems, multiple paths often exist between the same source and destination. This is known as multi-path routing.
Traceroute in such environments may show alternating paths or inconsistent hop sequences depending on how traffic is distributed. Each run of the command may reveal a slightly different route.
This complexity is intentional and helps improve performance and reliability. However, it also makes analysis more challenging because there is no single fixed path to observe.
Understanding multi-path behavior is important when interpreting traceroute results in enterprise or cloud environments. It helps avoid misinterpreting normal routing variation as a network problem.
Conclusion
Traceroute remains one of the most important diagnostic tools in Linux networking because it transforms invisible routing behavior into readable, step-by-step information. It reveals not only whether a destination is reachable but also how that destination is reached.
By exposing each hop, measuring latency, and highlighting routing behavior, traceroute provides a detailed view of network performance. It helps identify congestion points, routing inefficiencies, and potential failures across complex infrastructures.
Its ability to break down large-scale network communication into understandable segments makes it essential for troubleshooting and performance analysis. Whether used in simple connectivity checks or advanced network diagnostics, traceroute continues to be a foundational tool for understanding how data moves across systems.